library(tidyverse)
library(unvotes)
library(lubridate)
library(scales)Getting started
In-class example
Example: UN voting patterns
Your first class script eat-cake.R does two things:
- takes data that records every vote at the UN going back decades and cleans it
- visualizes voting patterns over time for the US and Turkey
At this point, none of this should “make sense” to you. You do not need to understand what each line of code here does. I just want you to run the code and try to make sense of what the different parts are doing.
Let’s break the script down:
The first thing the script does is load a set of packages, or libraries, which will give us access to the UN data and functions to use with that data.
We can see some of the UN data below:
| rcid | country | country_code | vote |
|---|---|---|---|
| 3 | United States | US | yes |
| 3 | Canada | CA | no |
| 3 | Cuba | CU | yes |
| 3 | Haiti | HT | yes |
| 3 | Dominican Republic | DO | yes |
The variable rcid is the way the data identifies the issue being voted on. So on RCID 3, the US voted “yes” while Canada voted “no”.
Here are some of the issues:
| rcid | date | short |
|---|---|---|
| 3 | 1946-01-01 | AMENDMENTS, RULES OF PROCEDURE |
| 4 | 1946-01-02 | SECURITY COUNCIL ELECTIONS |
| 5 | 1946-01-04 | VOTING PROCEDURE |
| 6 | 1946-01-04 | DECLARATION OF HUMAN RIGHTS |
| 7 | 1946-01-02 | GENERAL ASSEMBLY ELECTIONS |
The next chunk of code takes the UN voting data and calculates the percentage of times the US and Turkey voted “yes” on an issue in each year for which there is data.
You can see the results of this below:
| country | year | issue | votes | percent_yes |
|---|---|---|---|---|
| Turkey | 1946 | Colonialism | 15 | 0.80 |
| Turkey | 1946 | Economic development | 10 | 0.60 |
| Turkey | 1947 | Colonialism | 9 | 0.22 |
| Turkey | 1947 | Palestinian conflict | 7 | 0.14 |
| Turkey | 1948 | Colonialism | 12 | 0.42 |
| Turkey | 1948 | Arms control and disarmament | 9 | 0.00 |
So in 1946 Turkey voted 15 times on issues related to “Colonialism”, and of those votes, 80% were a “yes”.
This last bit of code produces the visualization:
ggplot(un_yes, aes(x = year, y = percent_yes, color = country)) +
  geom_point() +
  geom_smooth(method = "loess", se = FALSE) +
  facet_wrap(~ issue) +
  labs(
    title = "Percentage of 'Yes' votes in the UN General Assembly",
    subtitle = "1946 to 2015",
    y = "% Yes",
    x = "Year",
    color = "Country"
  ) +
  scale_y_continuous(labels = percent)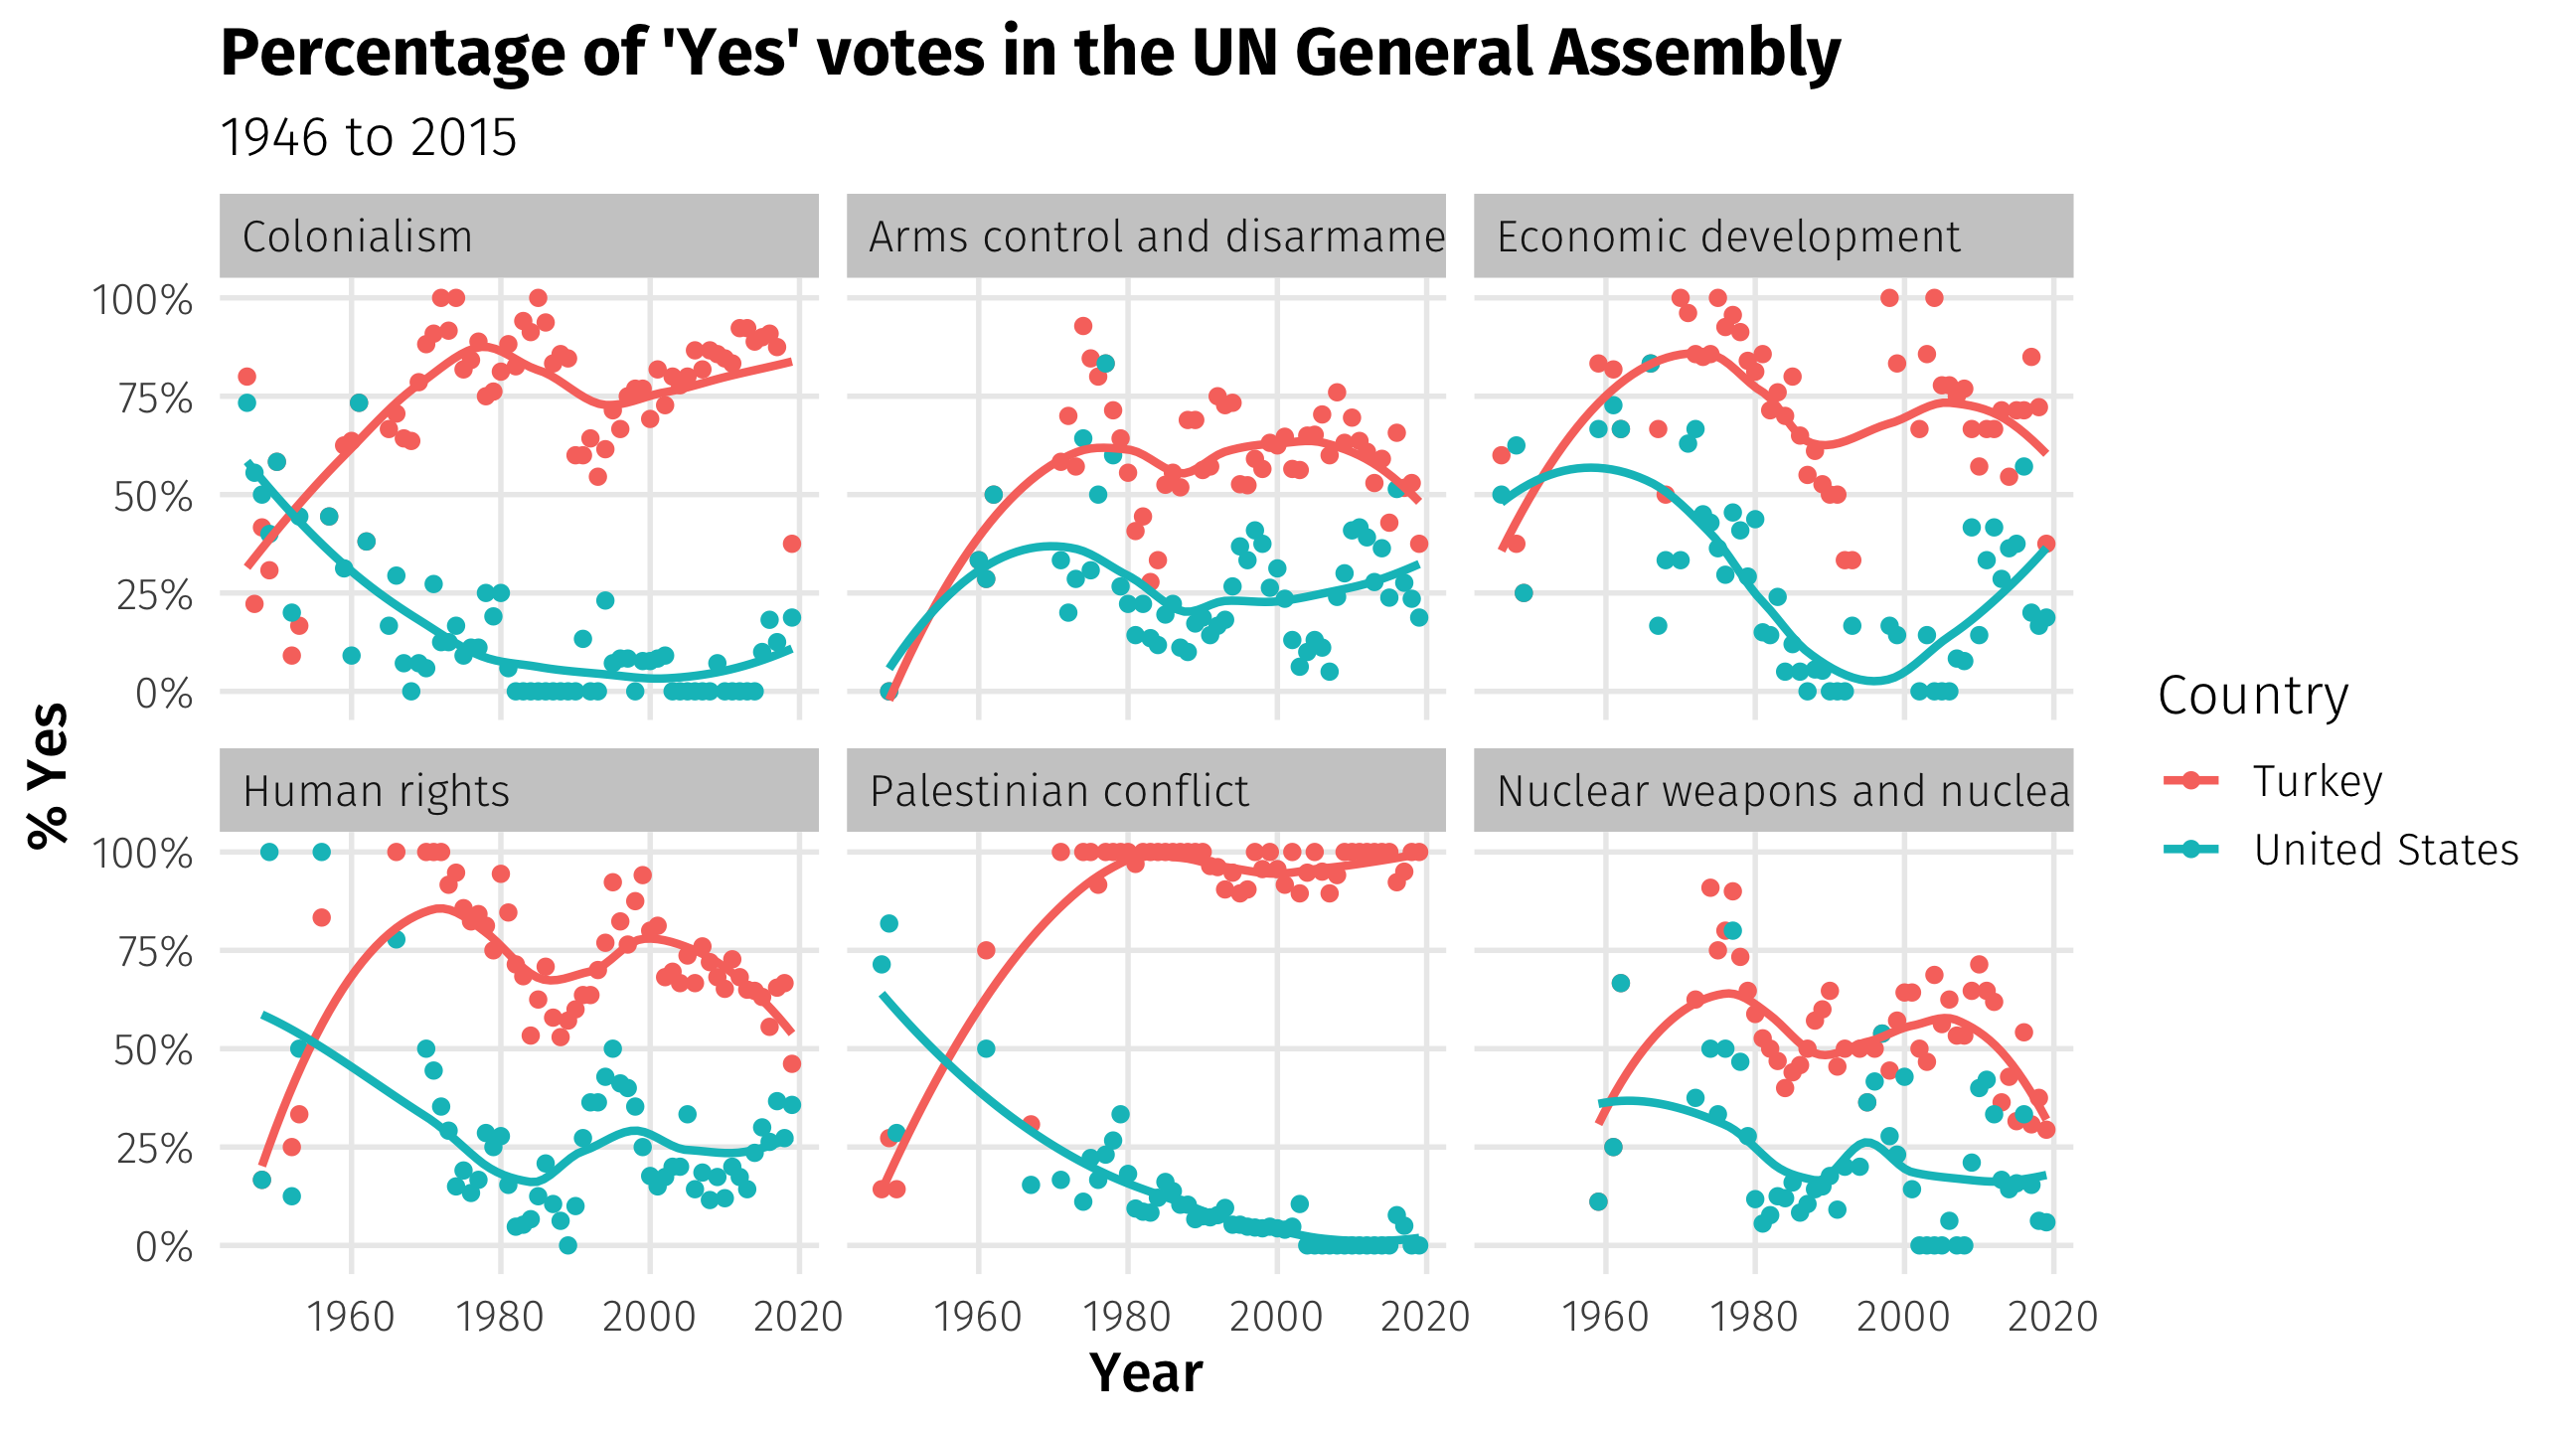
Try playing around with the code! What happens when you replace the United States and/or Turkey with another country?