# libraries
library(tidyverse)
library(nycflights13)Data wrangling
In-class example
Here’s the code we’ll be using in class:
- Day one: 👩💻 04-wrangle-code.R
- Day two: 👩💻 05-wrangle-code.R
Instructions:
Download it and store it with the rest of your materials for this course. If simply clicking doesn’t trigger download, you should right-click and select “save link as…”.
Upload to Posit Cloud
Filtering
Often, we have a big dataset that covers lots of stuff (say, all flights coming out of NYC in 2013) but we’re only interested in a subset of those things (say, flights that arrived late over that time period). The filter() function is a way to subset operations that match some rule or set of rules (e.g., rule = “flights that arrived late”). We define these rules using logical operators.
Examples
Let’s load the libraries.
Remember you can look at the data like this.
# look at the data
View(flights) # open data in viewer
?flights # read data documentation
Let’s look at flights from February.
# look at fights, but only from February
flights %>%
  filter(month == 2)
# A tibble: 24,951 × 19
year month day dep_time sched_dep_time dep_delay arr_time sched_arr_time
<int> <int> <int> <int> <int> <dbl> <int> <int>
1 2013 2 1 456 500 -4 652 648
2 2013 2 1 520 525 -5 816 820
3 2013 2 1 527 530 -3 837 829
4 2013 2 1 532 540 -8 1007 1017
5 2013 2 1 540 540 0 859 850
6 2013 2 1 552 600 -8 714 715
7 2013 2 1 552 600 -8 919 910
8 2013 2 1 552 600 -8 655 709
9 2013 2 1 553 600 -7 833 815
10 2013 2 1 553 600 -7 821 825
# ℹ 24,941 more rows
# ℹ 11 more variables: arr_delay <dbl>, carrier <chr>, flight <int>,
# tailnum <chr>, origin <chr>, dest <chr>, air_time <dbl>, distance <dbl>,
# hour <dbl>, minute <dbl>, time_hour <dttm>Let’s look at flights on Valentine’s Day.
# now let's look at flights on Valentine's Day
flights %>%
  filter(month == 2) %>%
  filter(day == 14)
# A tibble: 956 × 19
year month day dep_time sched_dep_time dep_delay arr_time sched_arr_time
<int> <int> <int> <int> <int> <dbl> <int> <int>
1 2013 2 14 7 2352 15 448 437
2 2013 2 14 59 2339 80 205 106
3 2013 2 14 454 500 -6 641 648
4 2013 2 14 510 515 -5 750 814
5 2013 2 14 531 530 1 828 831
6 2013 2 14 541 540 1 850 850
7 2013 2 14 542 545 -3 1014 1023
8 2013 2 14 551 600 -9 831 906
9 2013 2 14 552 600 -8 657 708
10 2013 2 14 553 600 -7 902 856
# ℹ 946 more rows
# ℹ 11 more variables: arr_delay <dbl>, carrier <chr>, flight <int>,
# tailnum <chr>, origin <chr>, dest <chr>, air_time <dbl>, distance <dbl>,
# hour <dbl>, minute <dbl>, time_hour <dttm>Let’s try the OR logical operator by looking at flights going to ATL or SFO.
# try one using text and the OR symbol
# look at fights going to ATL or SFO
flights %>%
  filter(dest == "ATL" | dest == "SFO")
# A tibble: 30,546 × 19
year month day dep_time sched_dep_time dep_delay arr_time sched_arr_time
<int> <int> <int> <int> <int> <dbl> <int> <int>
1 2013 1 1 554 600 -6 812 837
2 2013 1 1 558 600 -2 923 937
3 2013 1 1 600 600 0 837 825
4 2013 1 1 606 610 -4 837 845
5 2013 1 1 611 600 11 945 931
6 2013 1 1 615 615 0 833 842
7 2013 1 1 655 700 -5 1037 1045
8 2013 1 1 658 700 -2 944 939
9 2013 1 1 729 730 -1 1049 1115
10 2013 1 1 734 737 -3 1047 1113
# ℹ 30,536 more rows
# ℹ 11 more variables: arr_delay <dbl>, carrier <chr>, flight <int>,
# tailnum <chr>, origin <chr>, dest <chr>, air_time <dbl>, distance <dbl>,
# hour <dbl>, minute <dbl>, time_hour <dttm>Let’s look at flights between noon and 5pm.
# try one using greater than or less than
# look at flights departing between 12pm and 5pm
flights %>%
  filter(dep_time >= 1200) %>%
  filter(dep_time <= 1700)
# A tibble: 99,136 × 19
year month day dep_time sched_dep_time dep_delay arr_time sched_arr_time
<int> <int> <int> <int> <int> <dbl> <int> <int>
1 2013 1 1 1200 1200 0 1408 1356
2 2013 1 1 1202 1207 -5 1318 1314
3 2013 1 1 1202 1159 3 1645 1653
4 2013 1 1 1203 1205 -2 1501 1437
5 2013 1 1 1203 1200 3 1519 1545
6 2013 1 1 1204 1200 4 1500 1448
7 2013 1 1 1205 1200 5 1503 1505
8 2013 1 1 1206 1209 -3 1325 1328
9 2013 1 1 1208 1158 10 1540 1502
10 2013 1 1 1211 1215 -4 1423 1413
# ℹ 99,126 more rows
# ℹ 11 more variables: arr_delay <dbl>, carrier <chr>, flight <int>,
# tailnum <chr>, origin <chr>, dest <chr>, air_time <dbl>, distance <dbl>,
# hour <dbl>, minute <dbl>, time_hour <dttm>Let’s look at how many flights arrived late on christmas day.
## how many flights arrived LATE, on christmas day?
late_xmas = flights %>%
  filter(arr_time > sched_arr_time) %>%
  filter(month == 12, day == 25)
World leaders
The first leader:
# do your work here
leader |>
  filter(country == "VNM", yr_office == 1, age == 11)
# A tibble: 1 × 16
country gwcode leader gender year yr_office age edu mil_service combat
<chr> <dbl> <chr> <chr> <dbl> <dbl> <dbl> <fct> <dbl> <dbl>
1 VNM 815 Thanh Th… M 1889 1 11 Seco… 0 0
# ℹ 6 more variables: rebel <dbl>, yrs_exp <dbl>, phys_health <dbl>,
# mental_health <dbl>, will_force <dbl>, will_force_sd <dbl>The second leaders:
leader |>
  filter(edu == "Graduate", year == 2015, yr_office == 16)
# A tibble: 2 × 16
country gwcode leader gender year yr_office age edu mil_service combat
<chr> <dbl> <chr> <chr> <dbl> <dbl> <dbl> <fct> <dbl> <dbl>
1 RUS 365 Putin M 2015 16 63 Grad… 0 0
2 SYR 652 Bashar a… M 2015 16 50 Grad… 1 0
# ℹ 6 more variables: rebel <dbl>, yrs_exp <dbl>, phys_health <dbl>,
# mental_health <dbl>, will_force <dbl>, will_force_sd <dbl>The third leaders:
leader |> filter(yr_office > 20) |>
  filter(rebel == 1) |>
  filter(will_force > 1.7)
# A tibble: 46 × 16
country gwcode leader gender year yr_office age edu mil_service combat
<chr> <dbl> <chr> <chr> <dbl> <dbl> <dbl> <fct> <dbl> <dbl>
1 MEX 70 Diaz M 1896 21 66 Univer… 1 1
2 MEX 70 Diaz M 1897 22 67 Univer… 1 1
3 MEX 70 Diaz M 1898 23 68 Univer… 1 1
4 MEX 70 Diaz M 1899 24 69 Univer… 1 1
5 MEX 70 Diaz M 1900 25 70 Univer… 1 1
6 MEX 70 Diaz M 1901 26 71 Univer… 1 1
7 MEX 70 Diaz M 1902 27 72 Univer… 1 1
8 MEX 70 Diaz M 1903 28 73 Univer… 1 1
9 MEX 70 Diaz M 1904 29 74 Univer… 1 1
10 MEX 70 Diaz M 1905 30 75 Univer… 1 1
# ℹ 36 more rows
# ℹ 6 more variables: rebel <dbl>, yrs_exp <dbl>, phys_health <dbl>,
# mental_health <dbl>, will_force <dbl>, will_force_sd <dbl>Mutating
Climate
Here is how to do the climate example,
Graph 1:
sub_climate = climate |>
  filter(country == "Germany" | country == "United States" |
           country == "China" | country == "India") |>
  mutate(co2_capita = co2 / population)


ggplot(data = sub_climate, aes(x = year, y = co2, color = country)) + geom_line()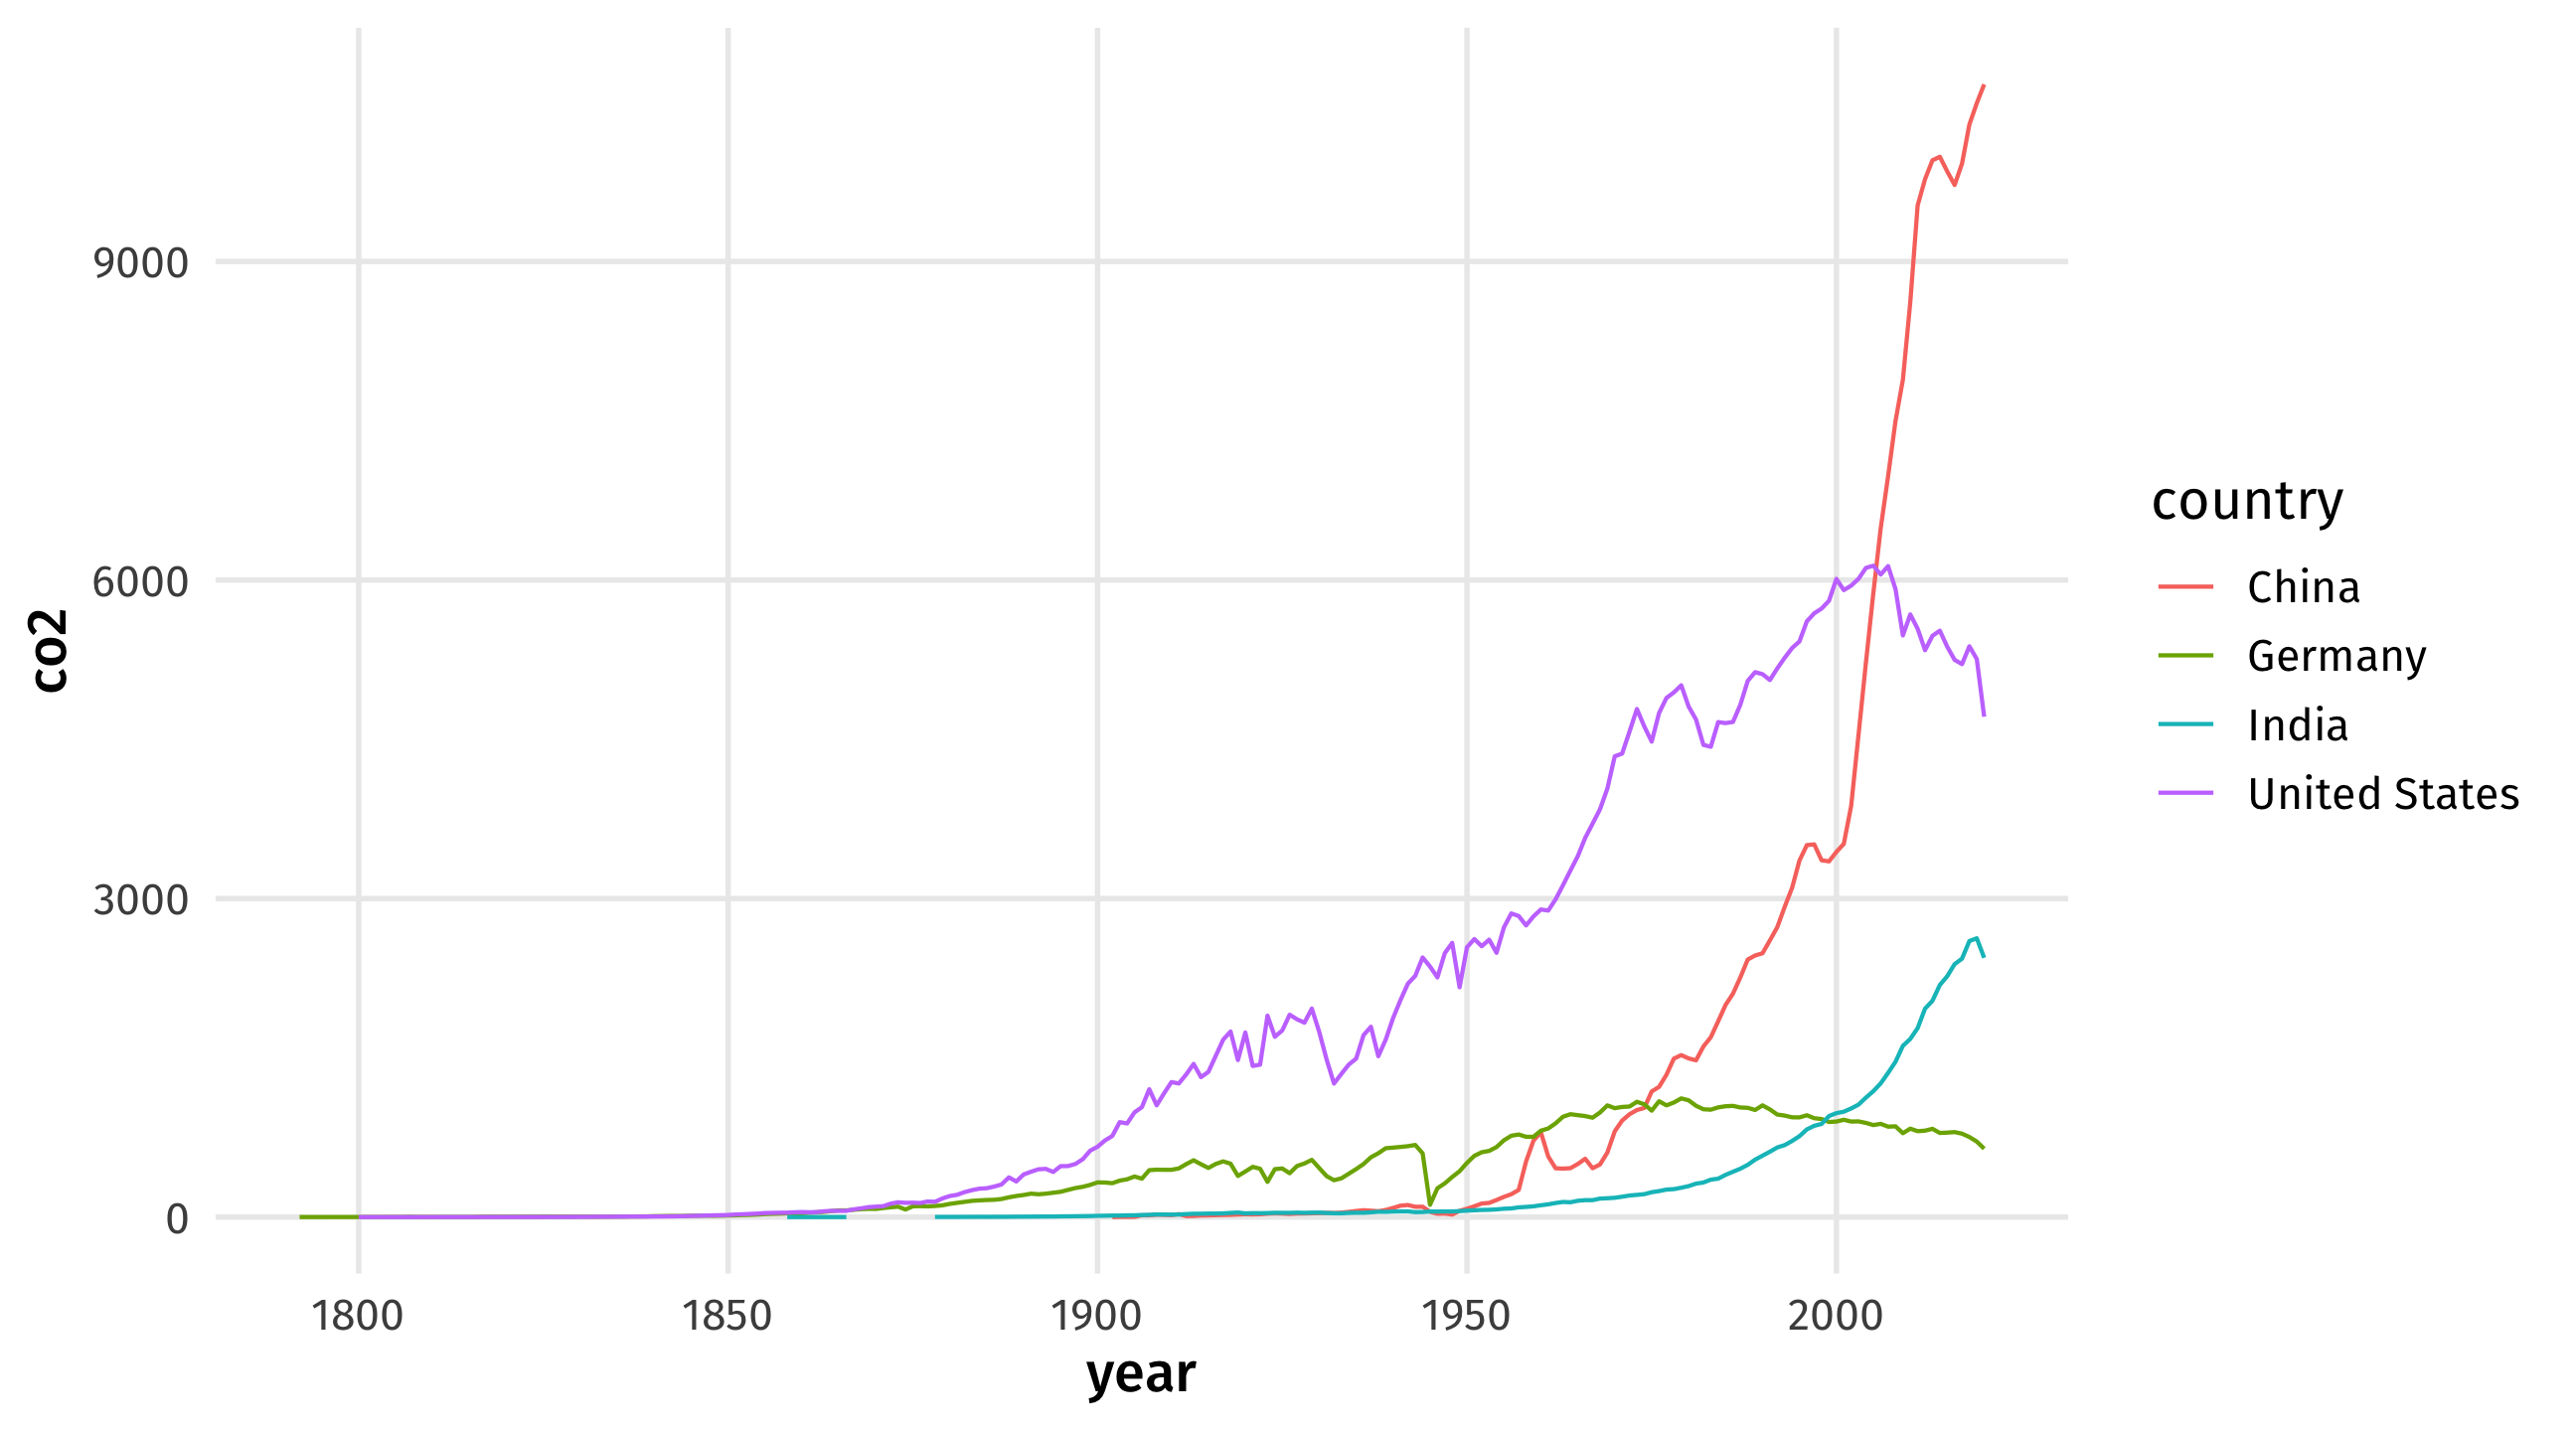
Graph 2:
ggplot(data = sub_climate, aes(x = year, y = co2_capita, color = country)) + geom_line()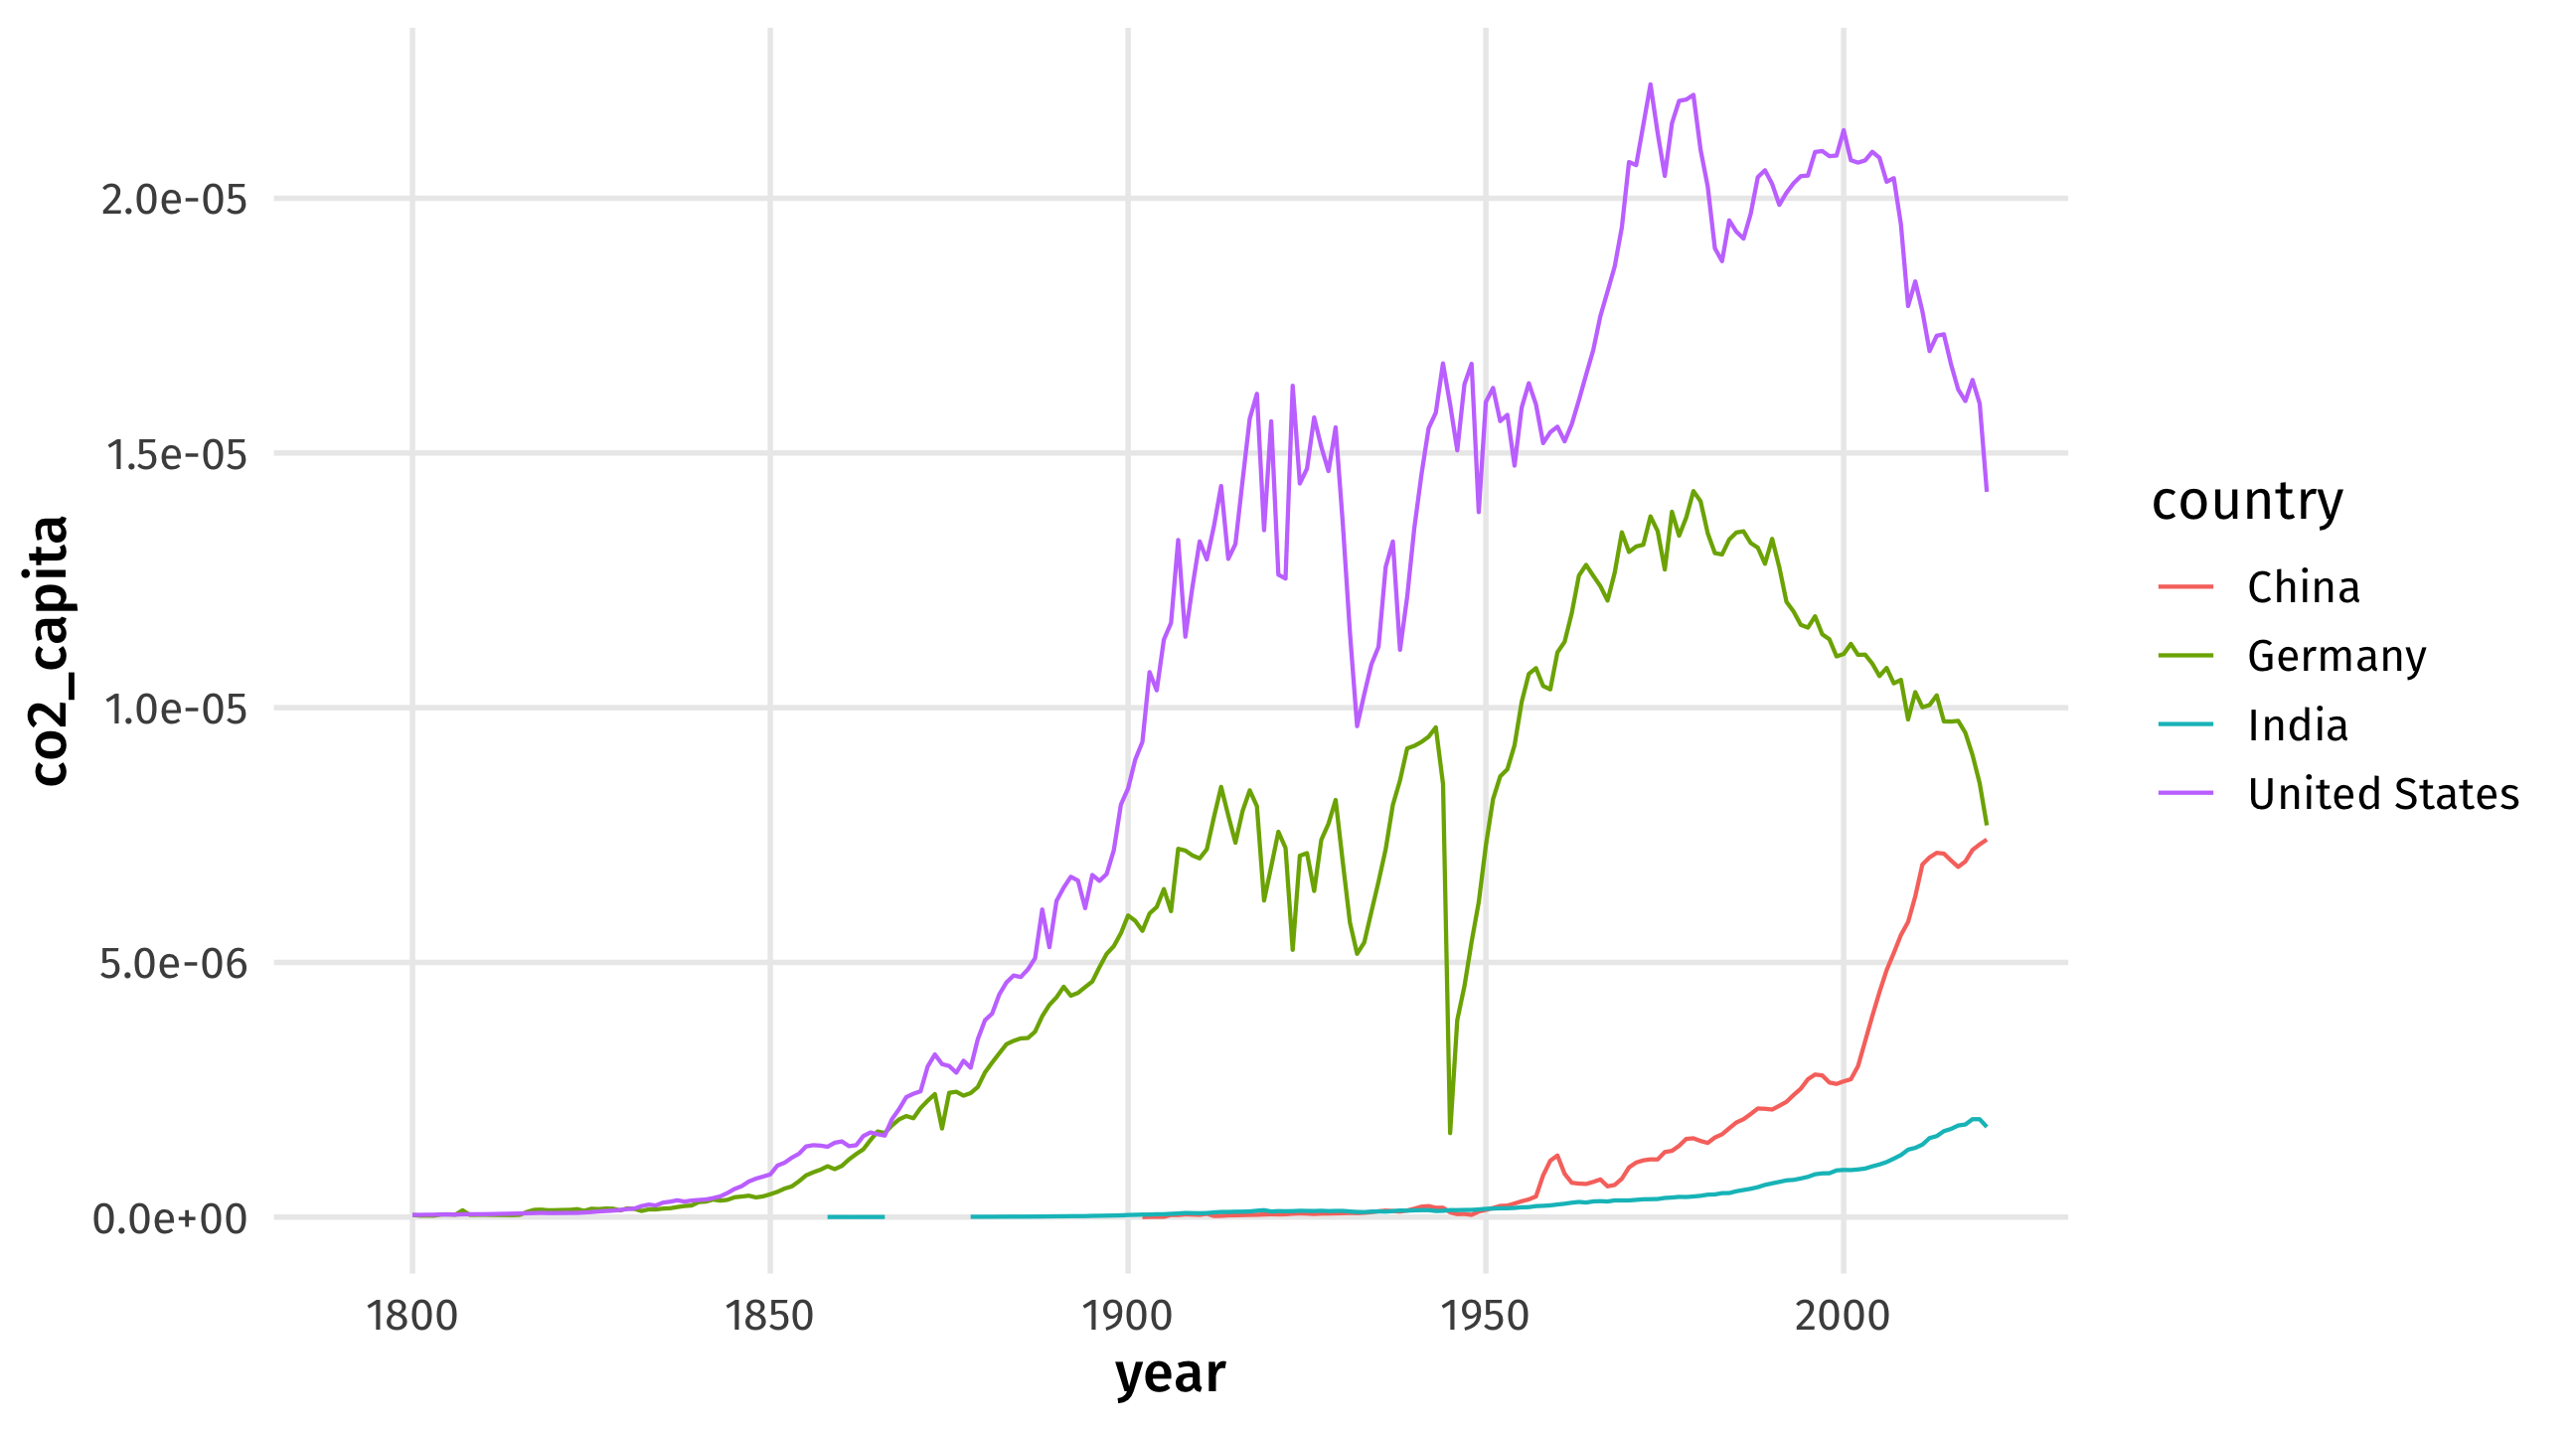
Elections
Here is how we classify elections based on who won:
cat_elections = elections |>
  mutate(who_won = case_when(per_dem_2012 > per_gop_2012 & per_dem_2016 > per_gop_2016 ~ "blue",
                             per_dem_2012 < per_gop_2012 & per_dem_2016 < per_gop_2016 ~ "red",
                             per_dem_2012 > per_gop_2012 & per_dem_2016 < per_gop_2016 ~ "flipped red",
                             per_dem_2012 < per_gop_2012 & per_dem_2016 > per_gop_2016 ~ "flipped blue"))


ggplot(cat_elections, aes(y = who_won, x = hh_income)) + geom_boxplot()