DAGs I
POL51
September 30, 2024
Why DAG
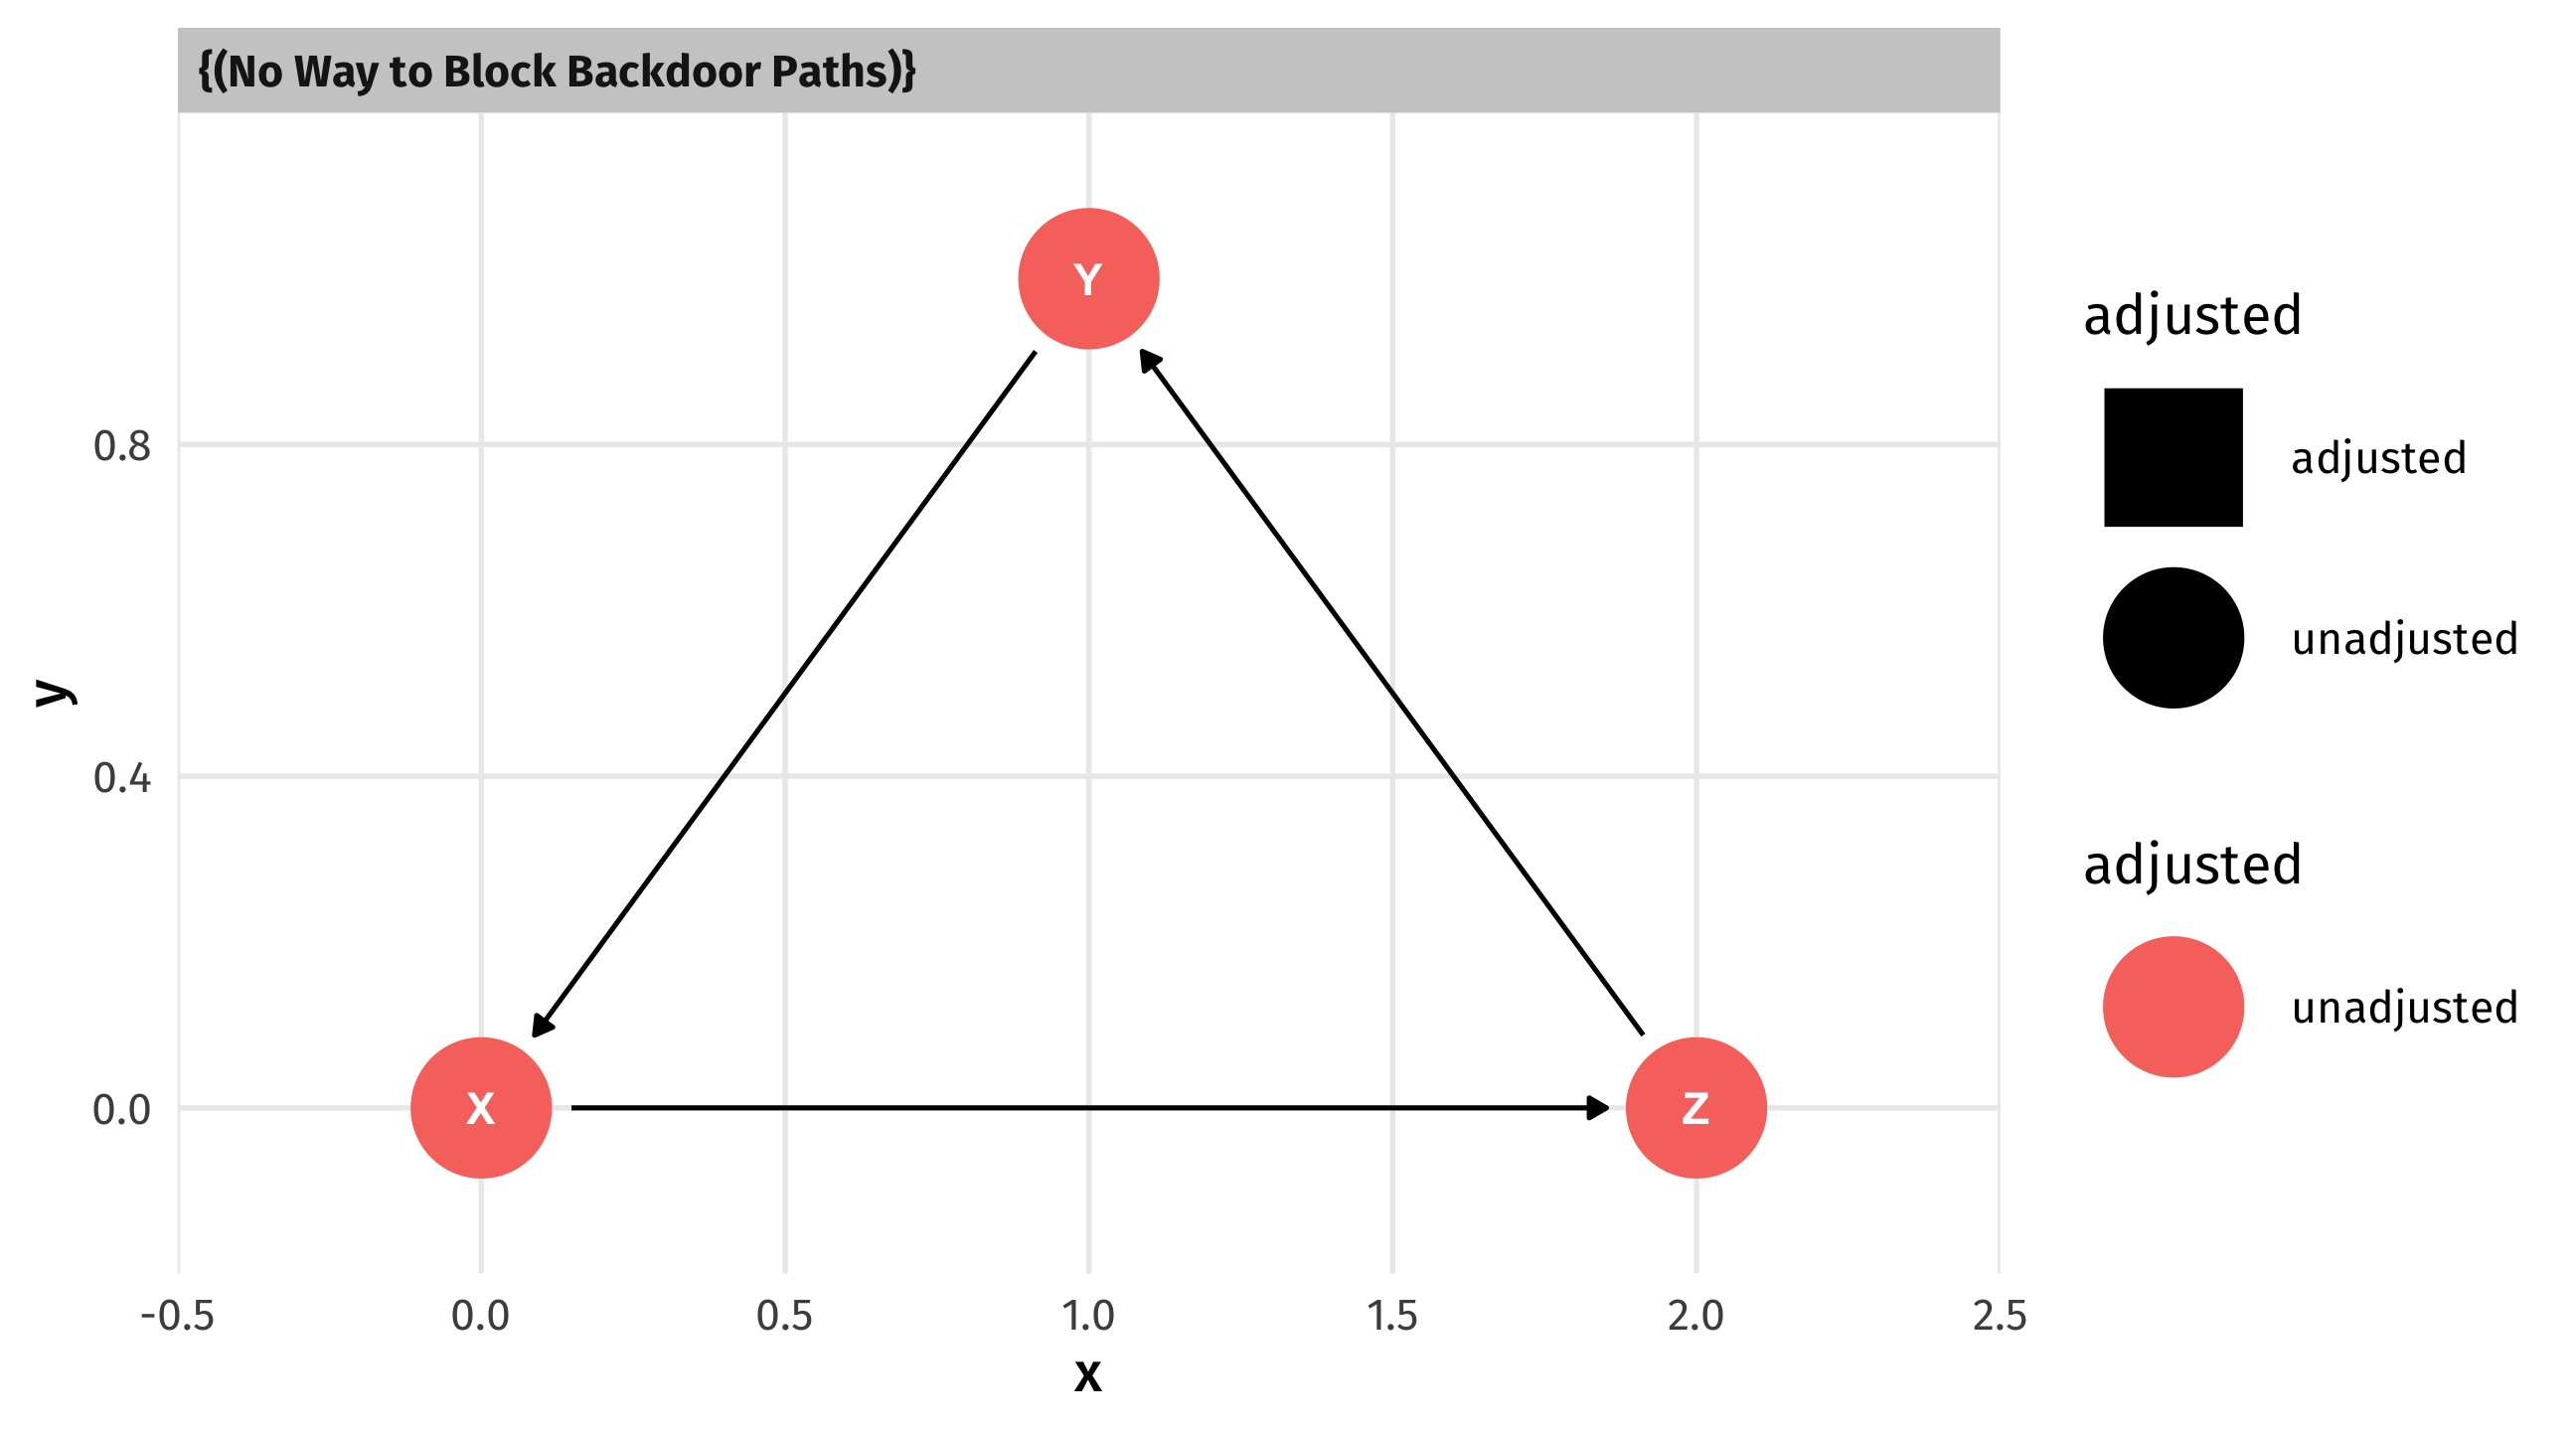
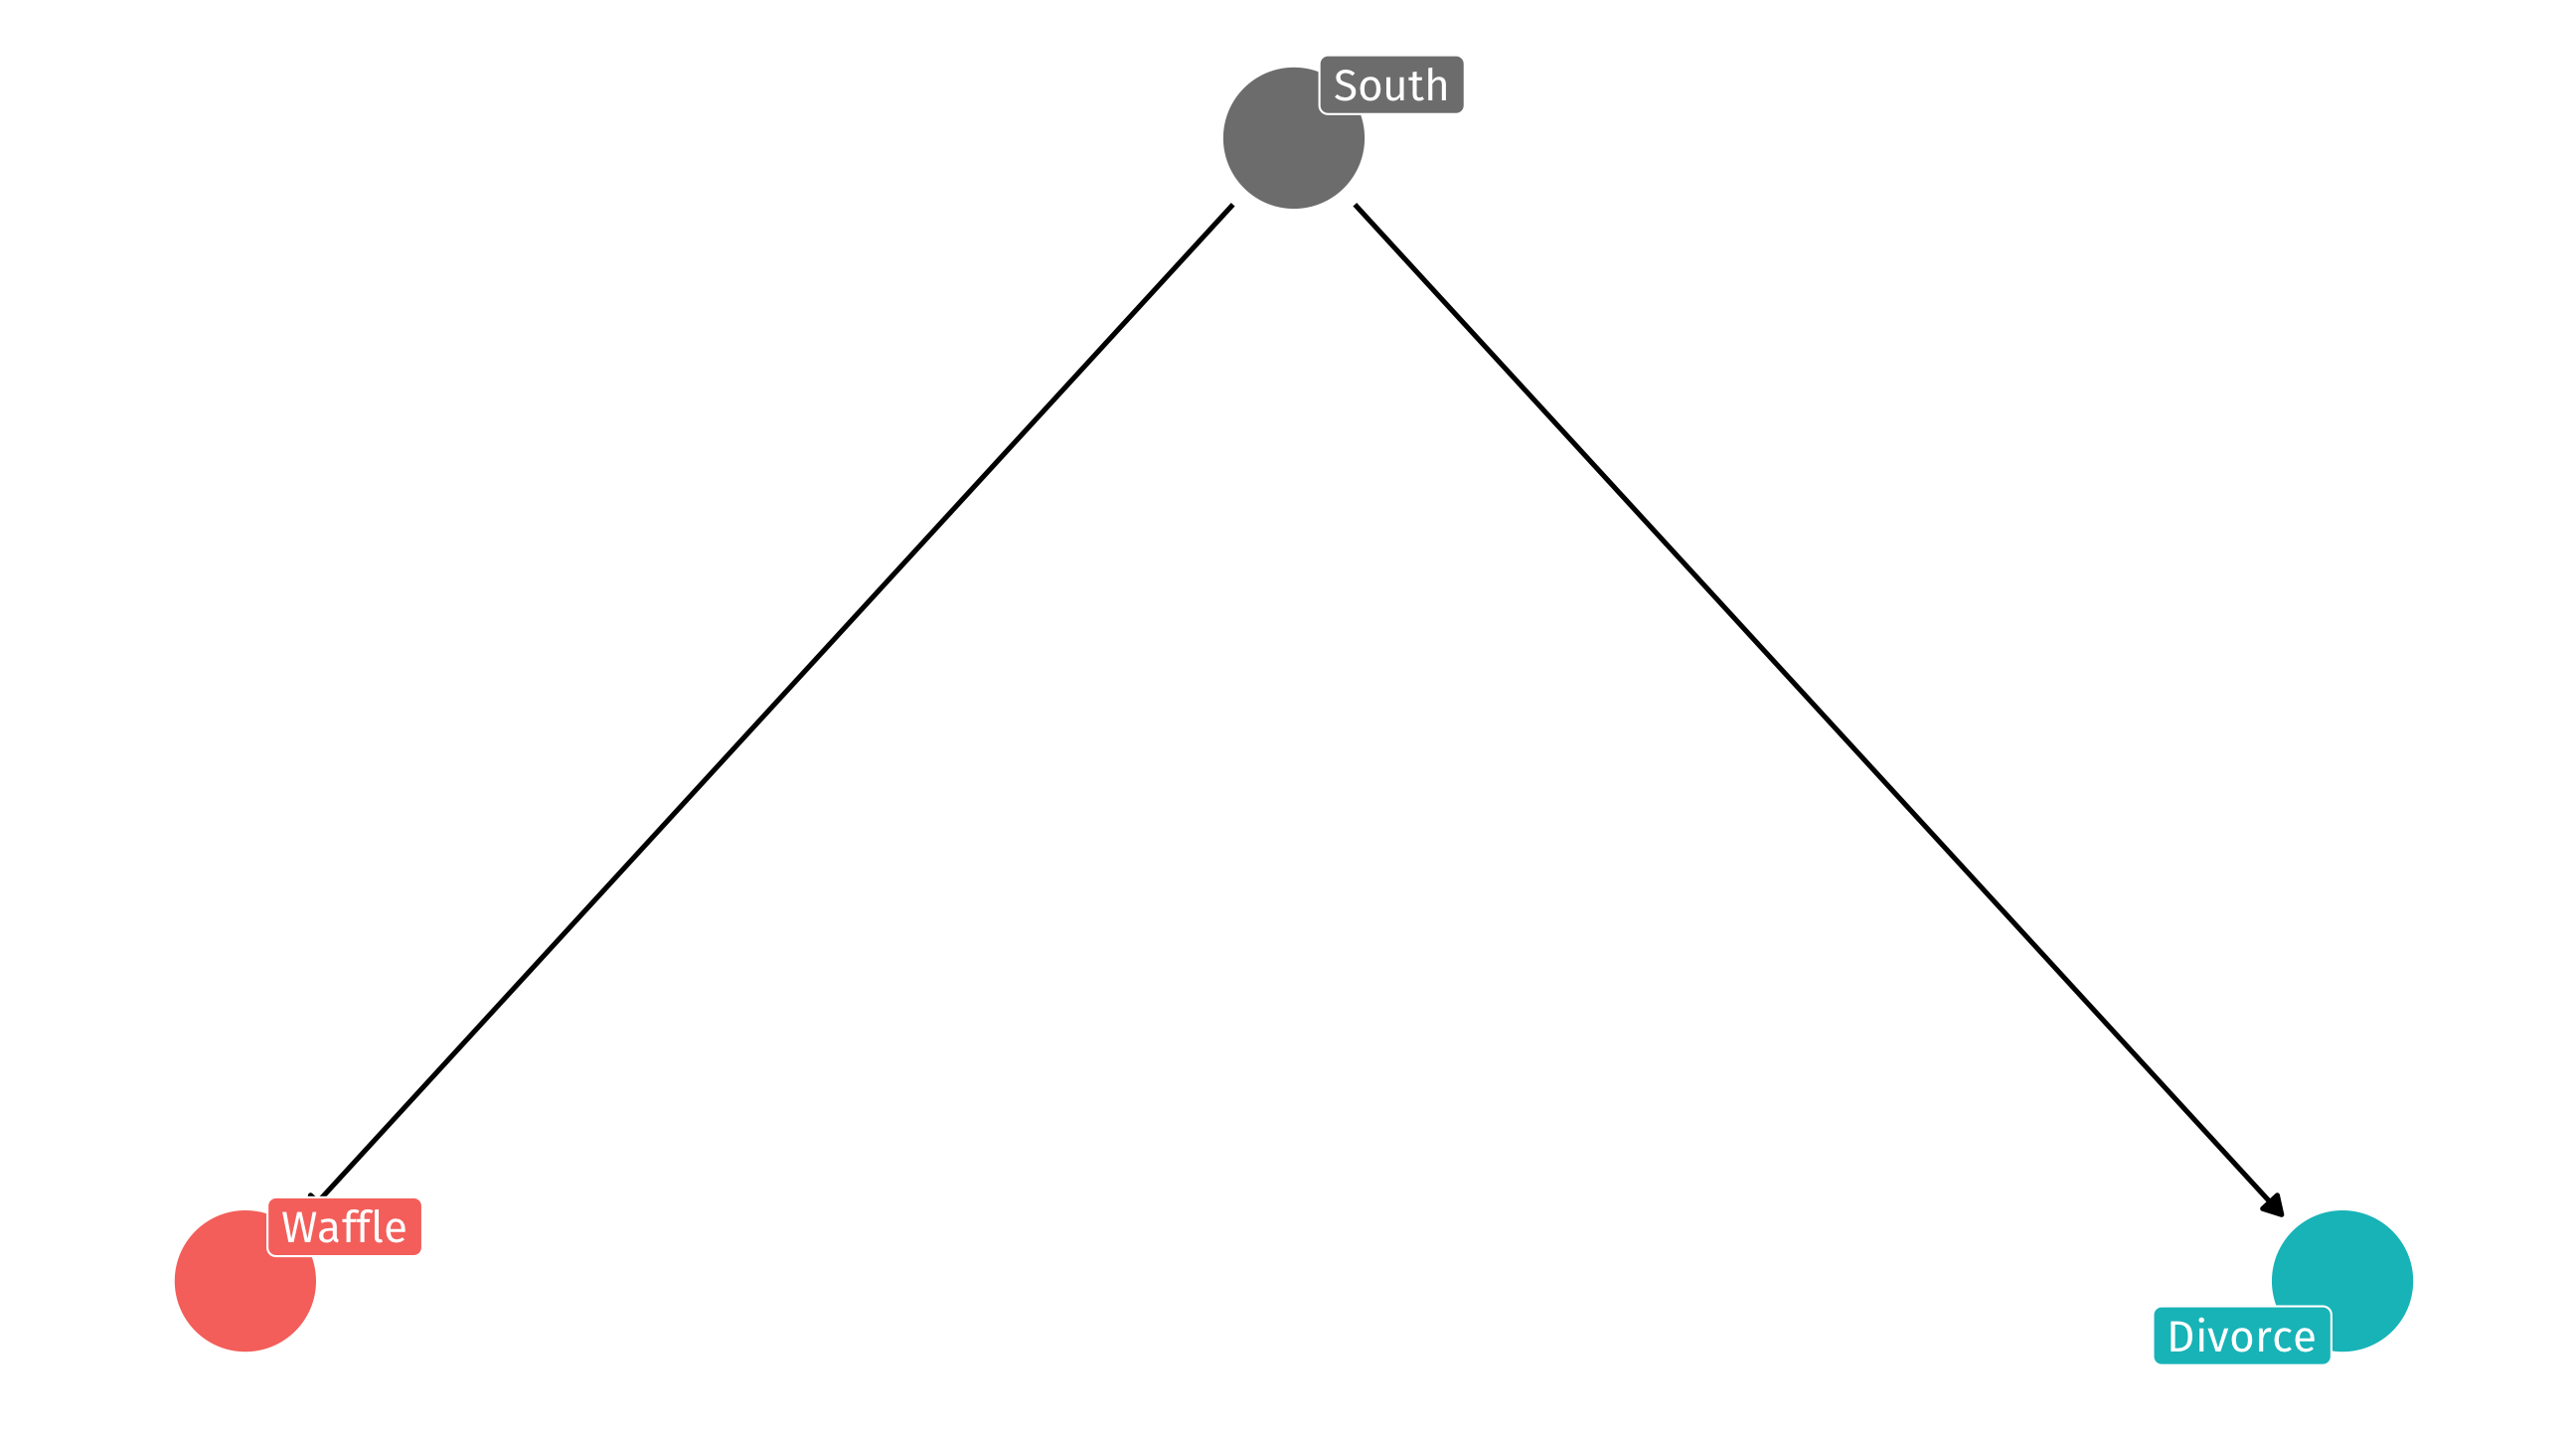
We know that the DAG on the left will produce the spurious correlation on the right
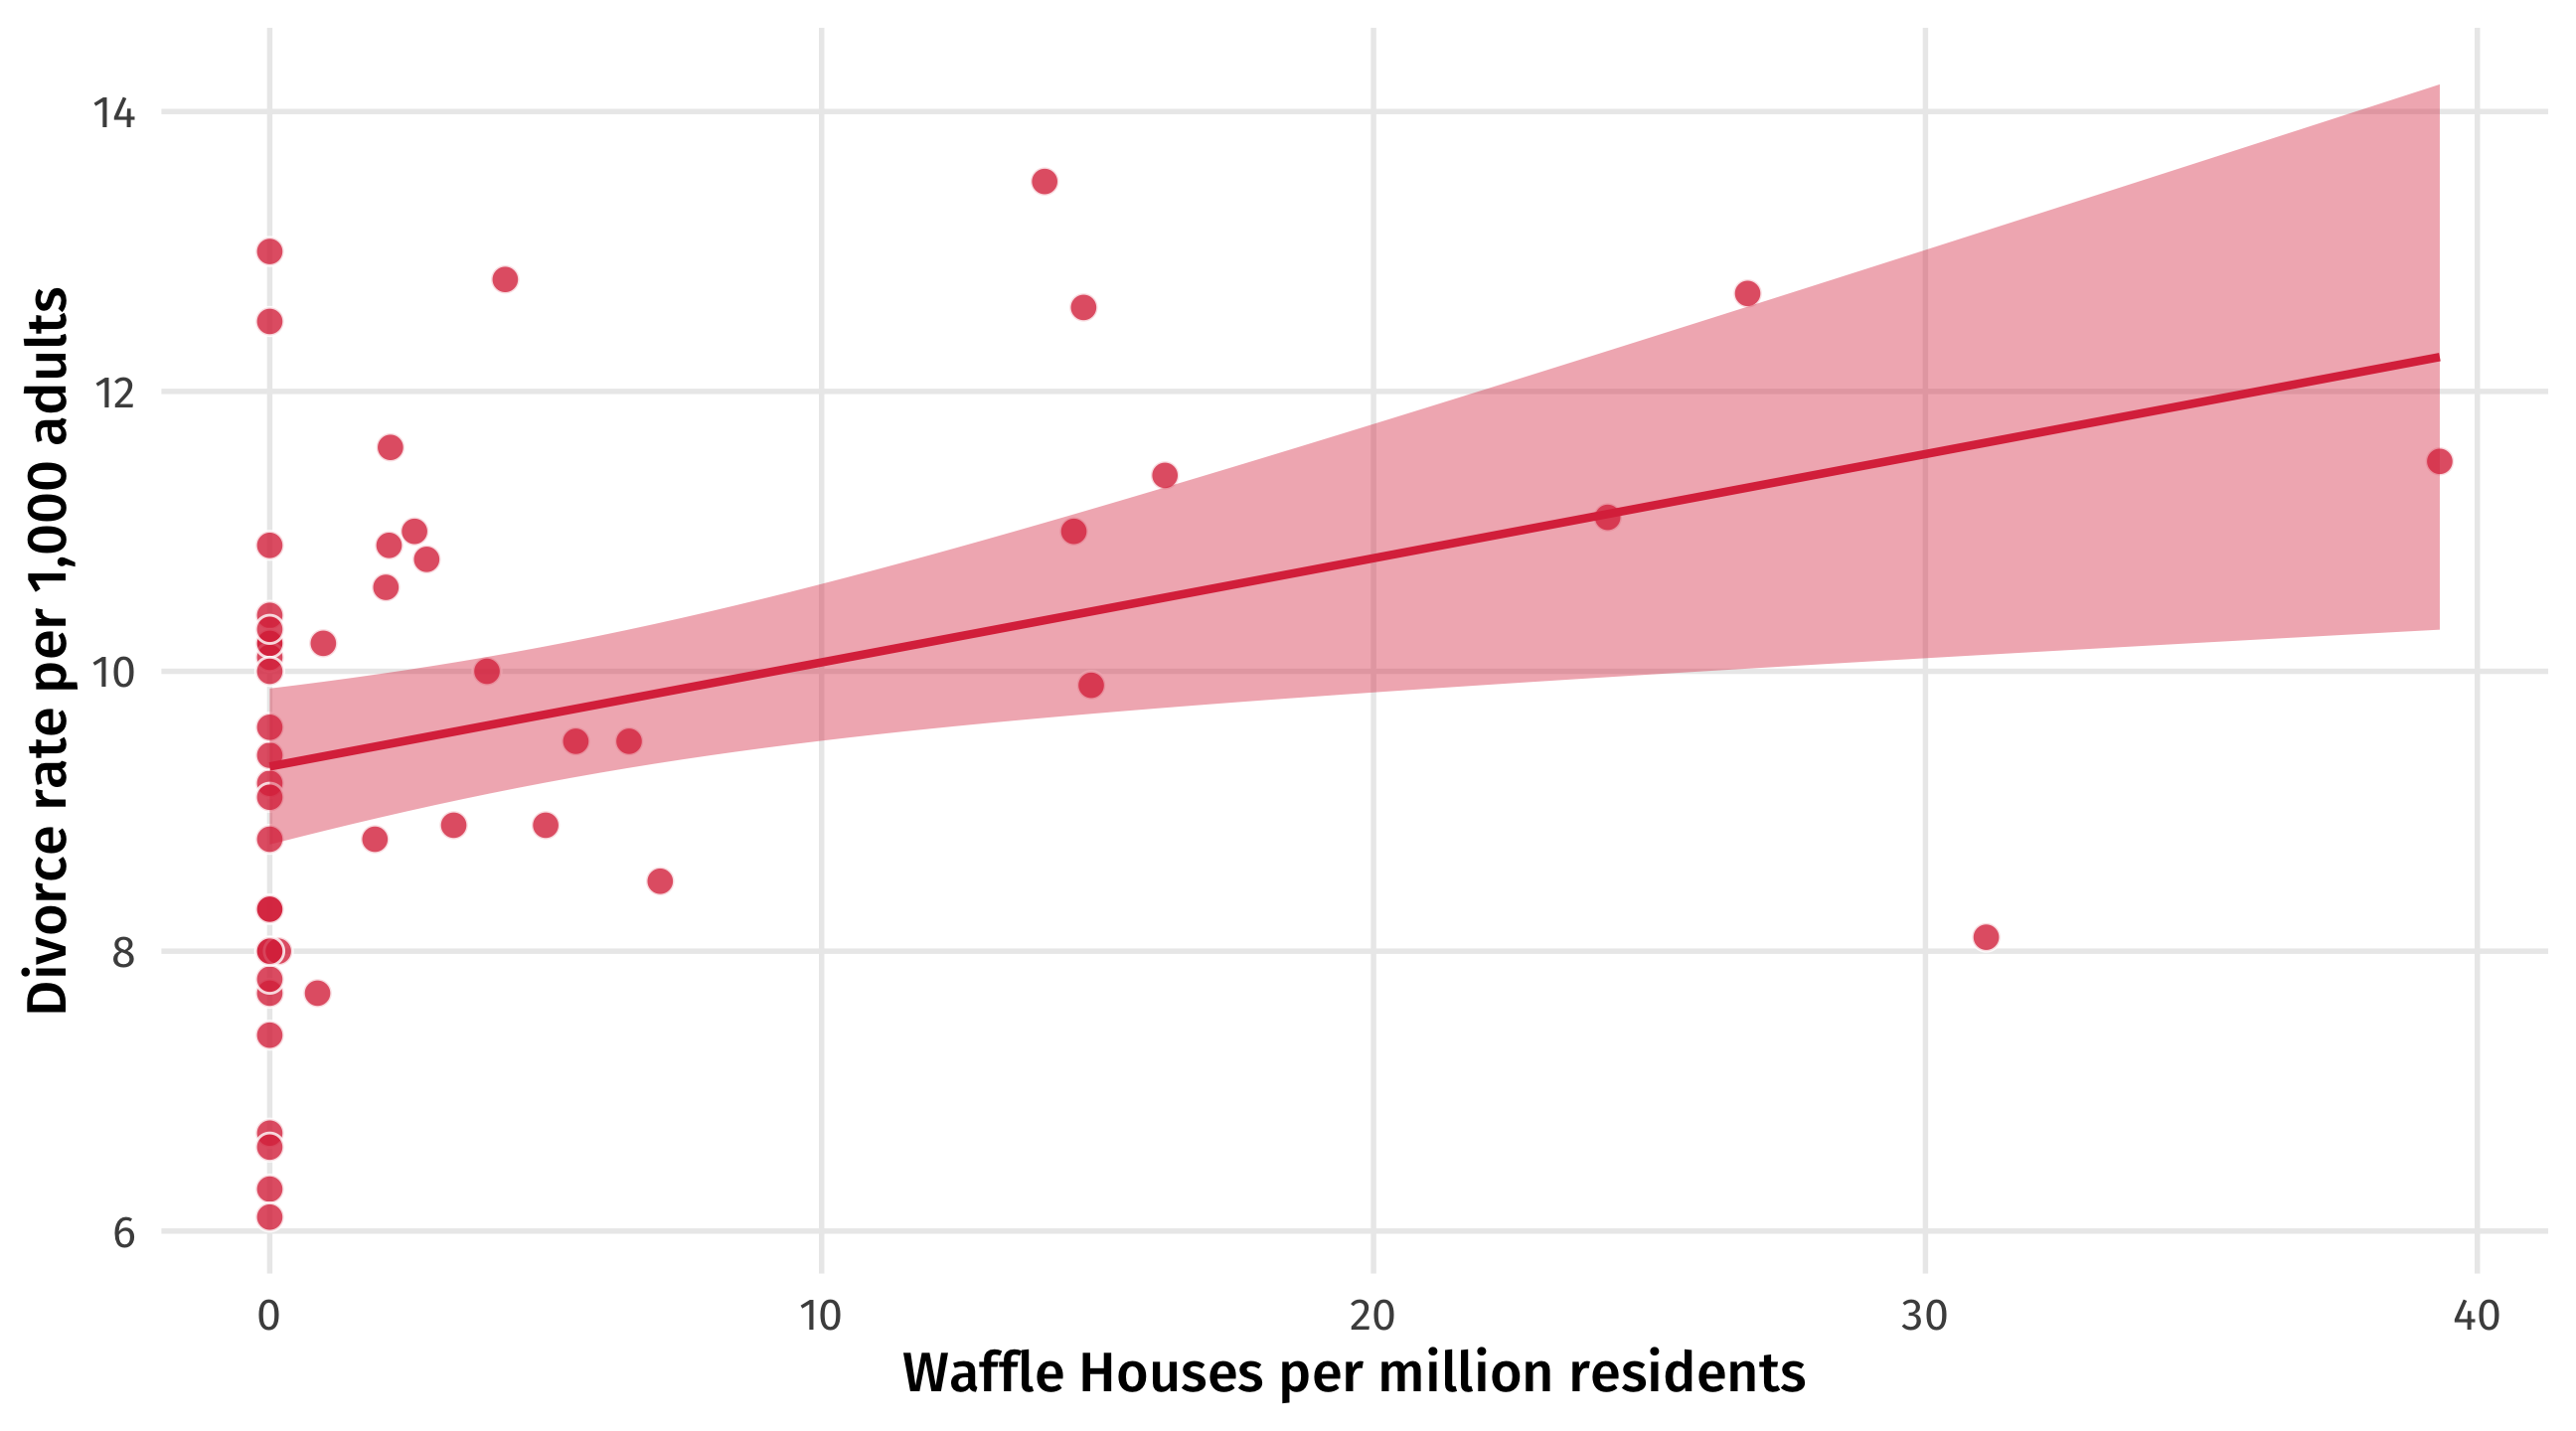
Regardless of whether or not waffles cause divorce
Why not control for everything?
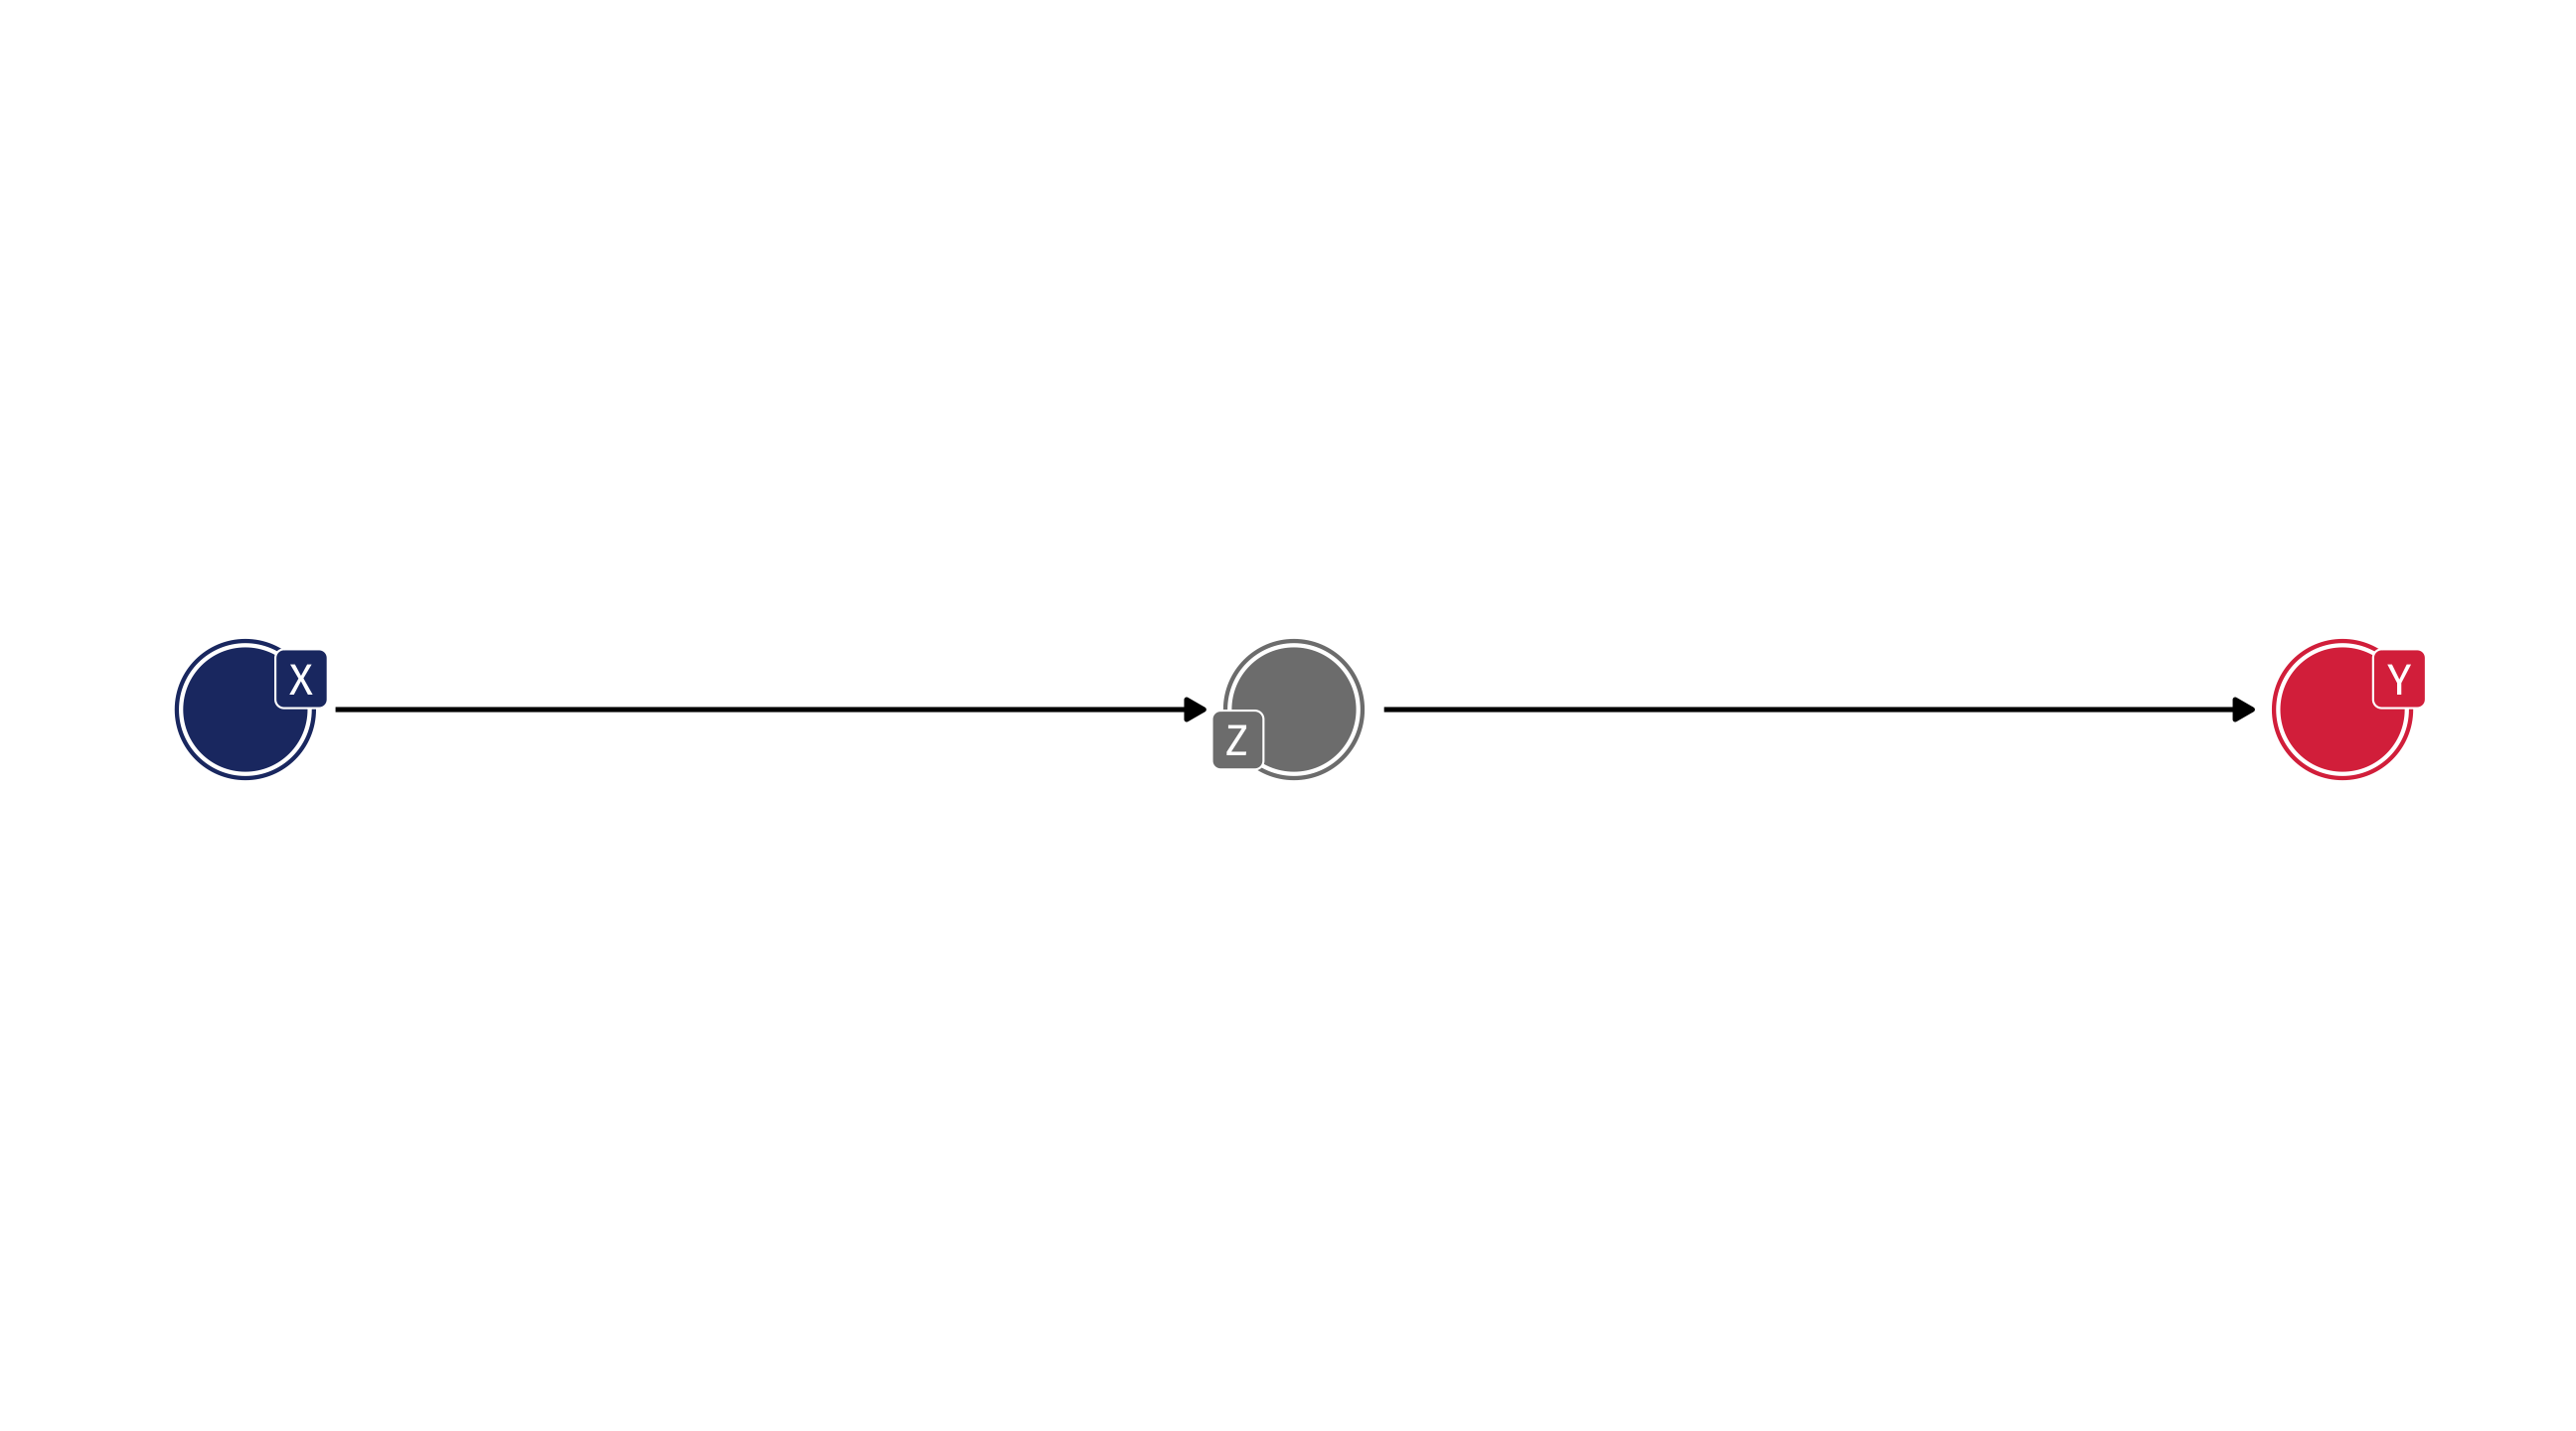
Controlling for the wrong thing can close a perplexing pipe – this erases part or all of the effect that X has on Y
Or open up an exploding collider – creates weird correlation between X and Y
Bias in use of force
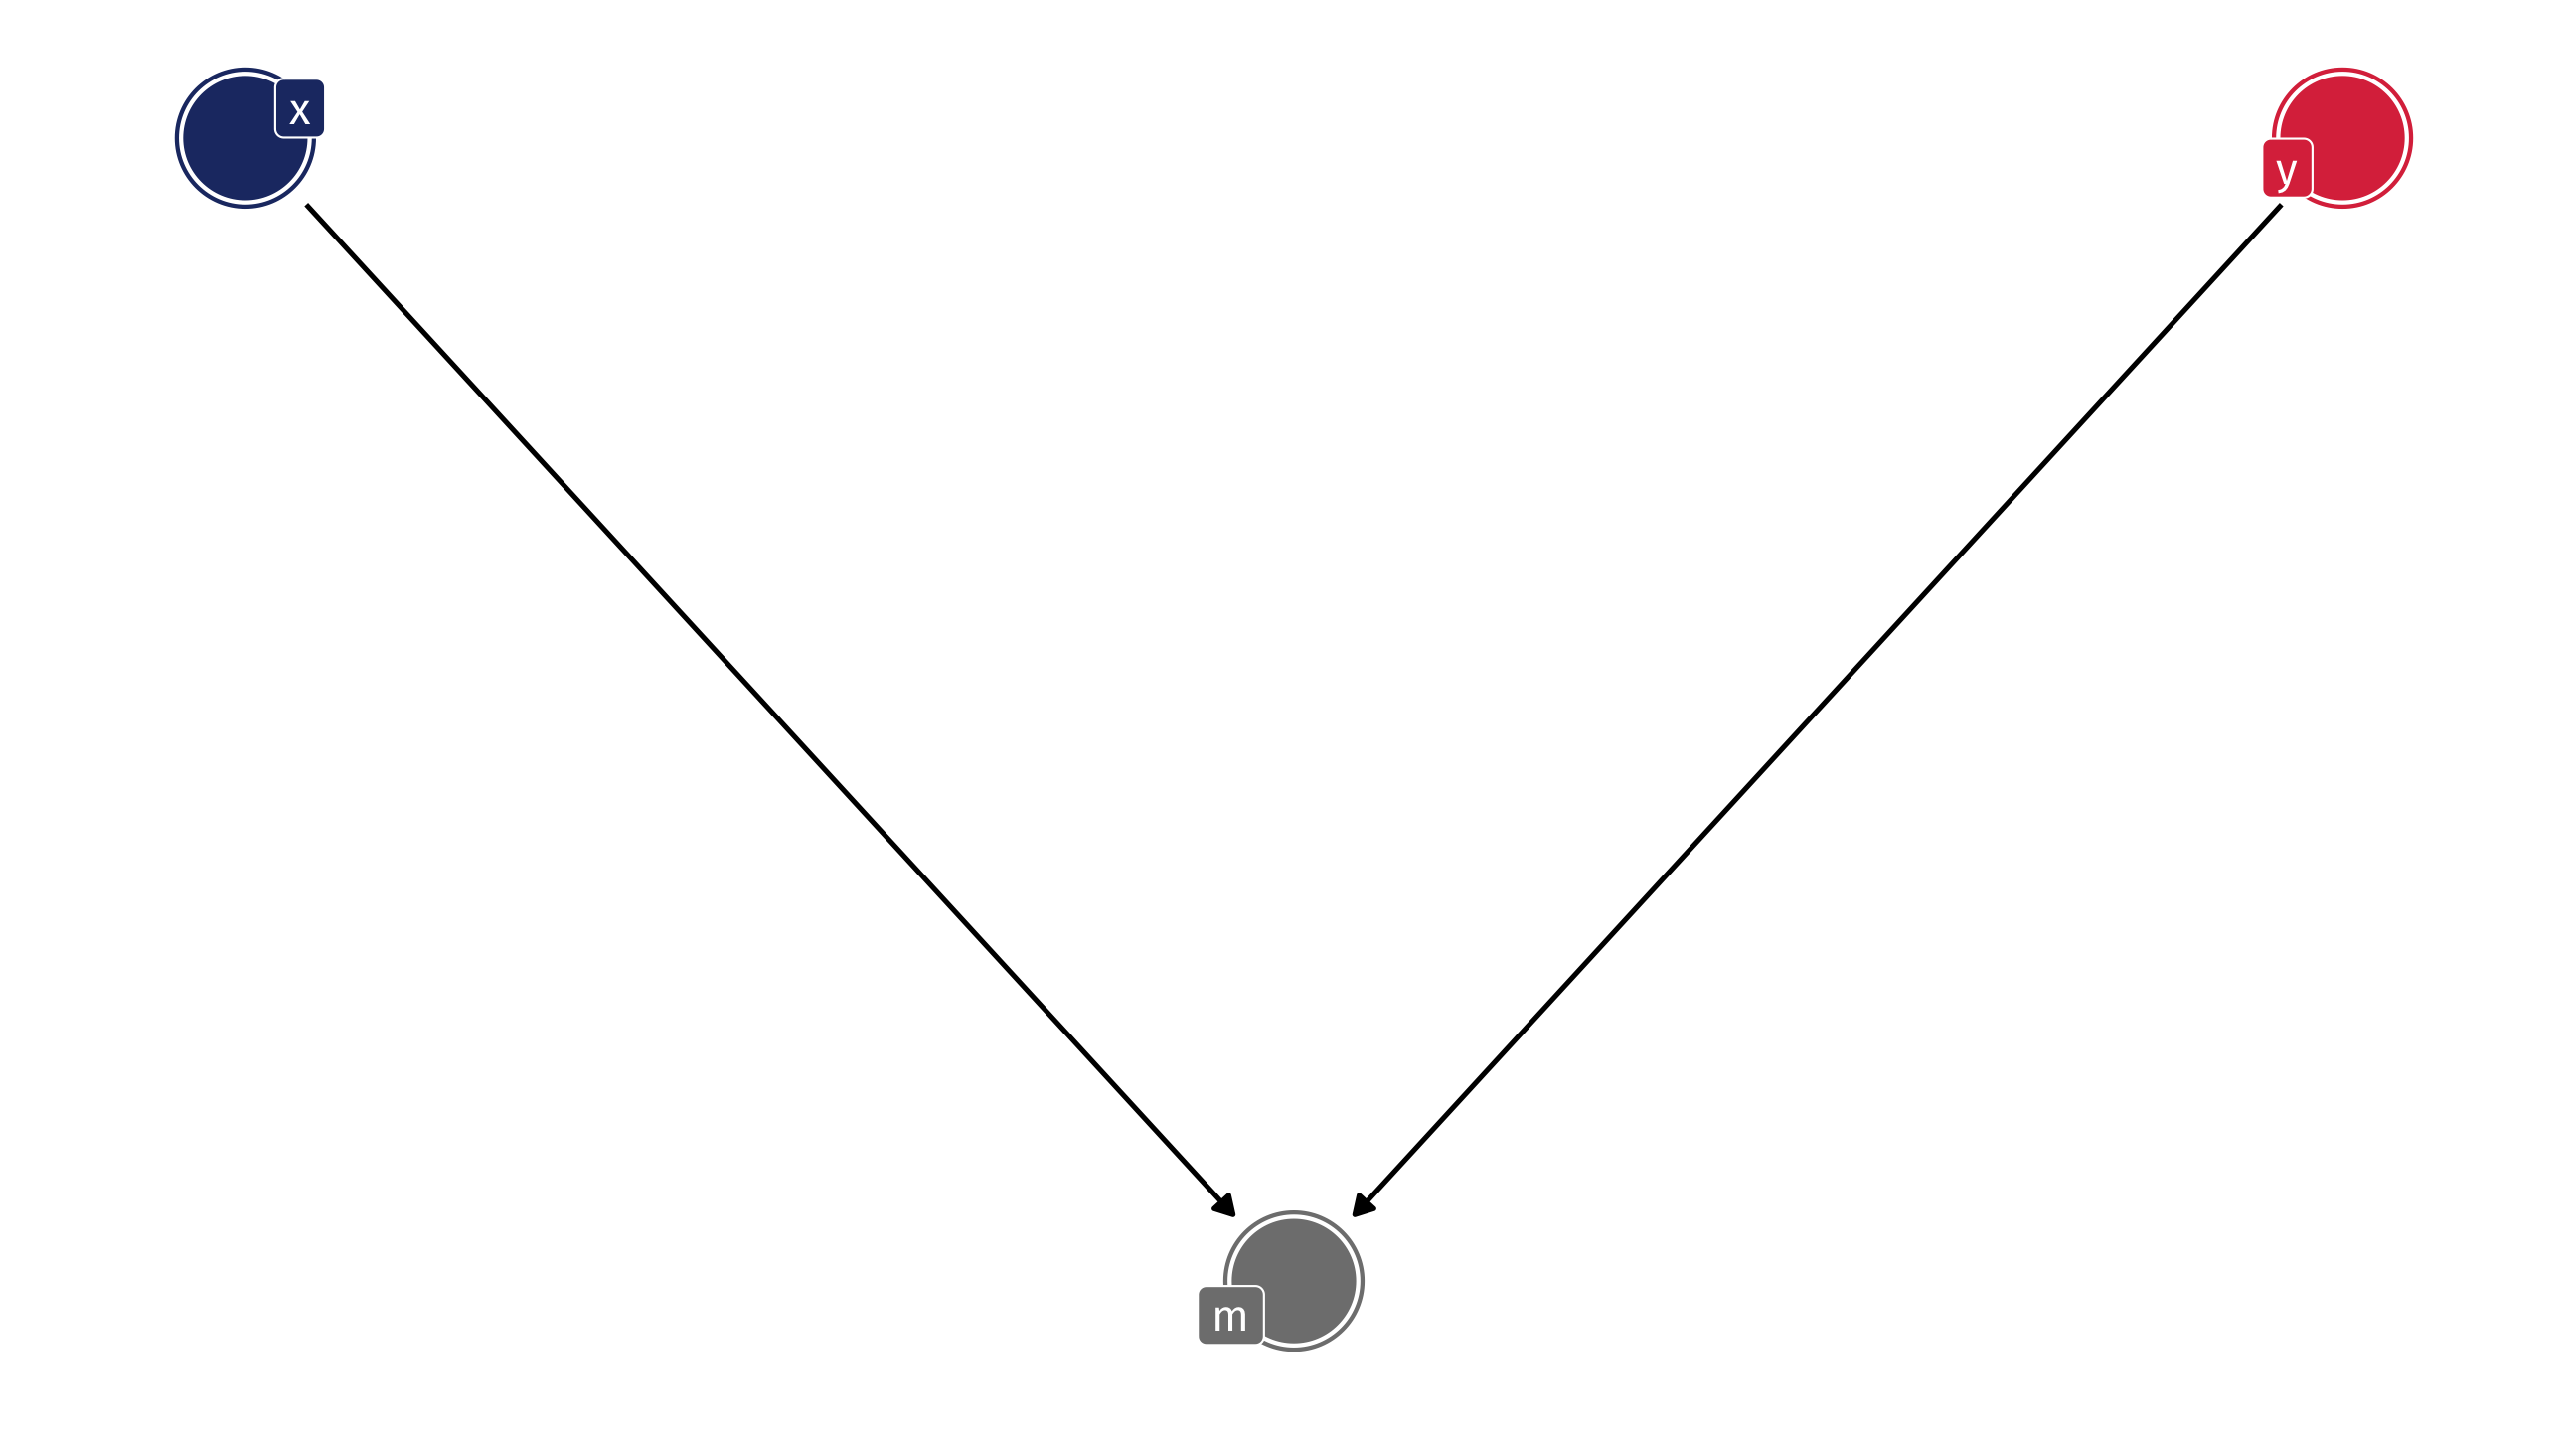
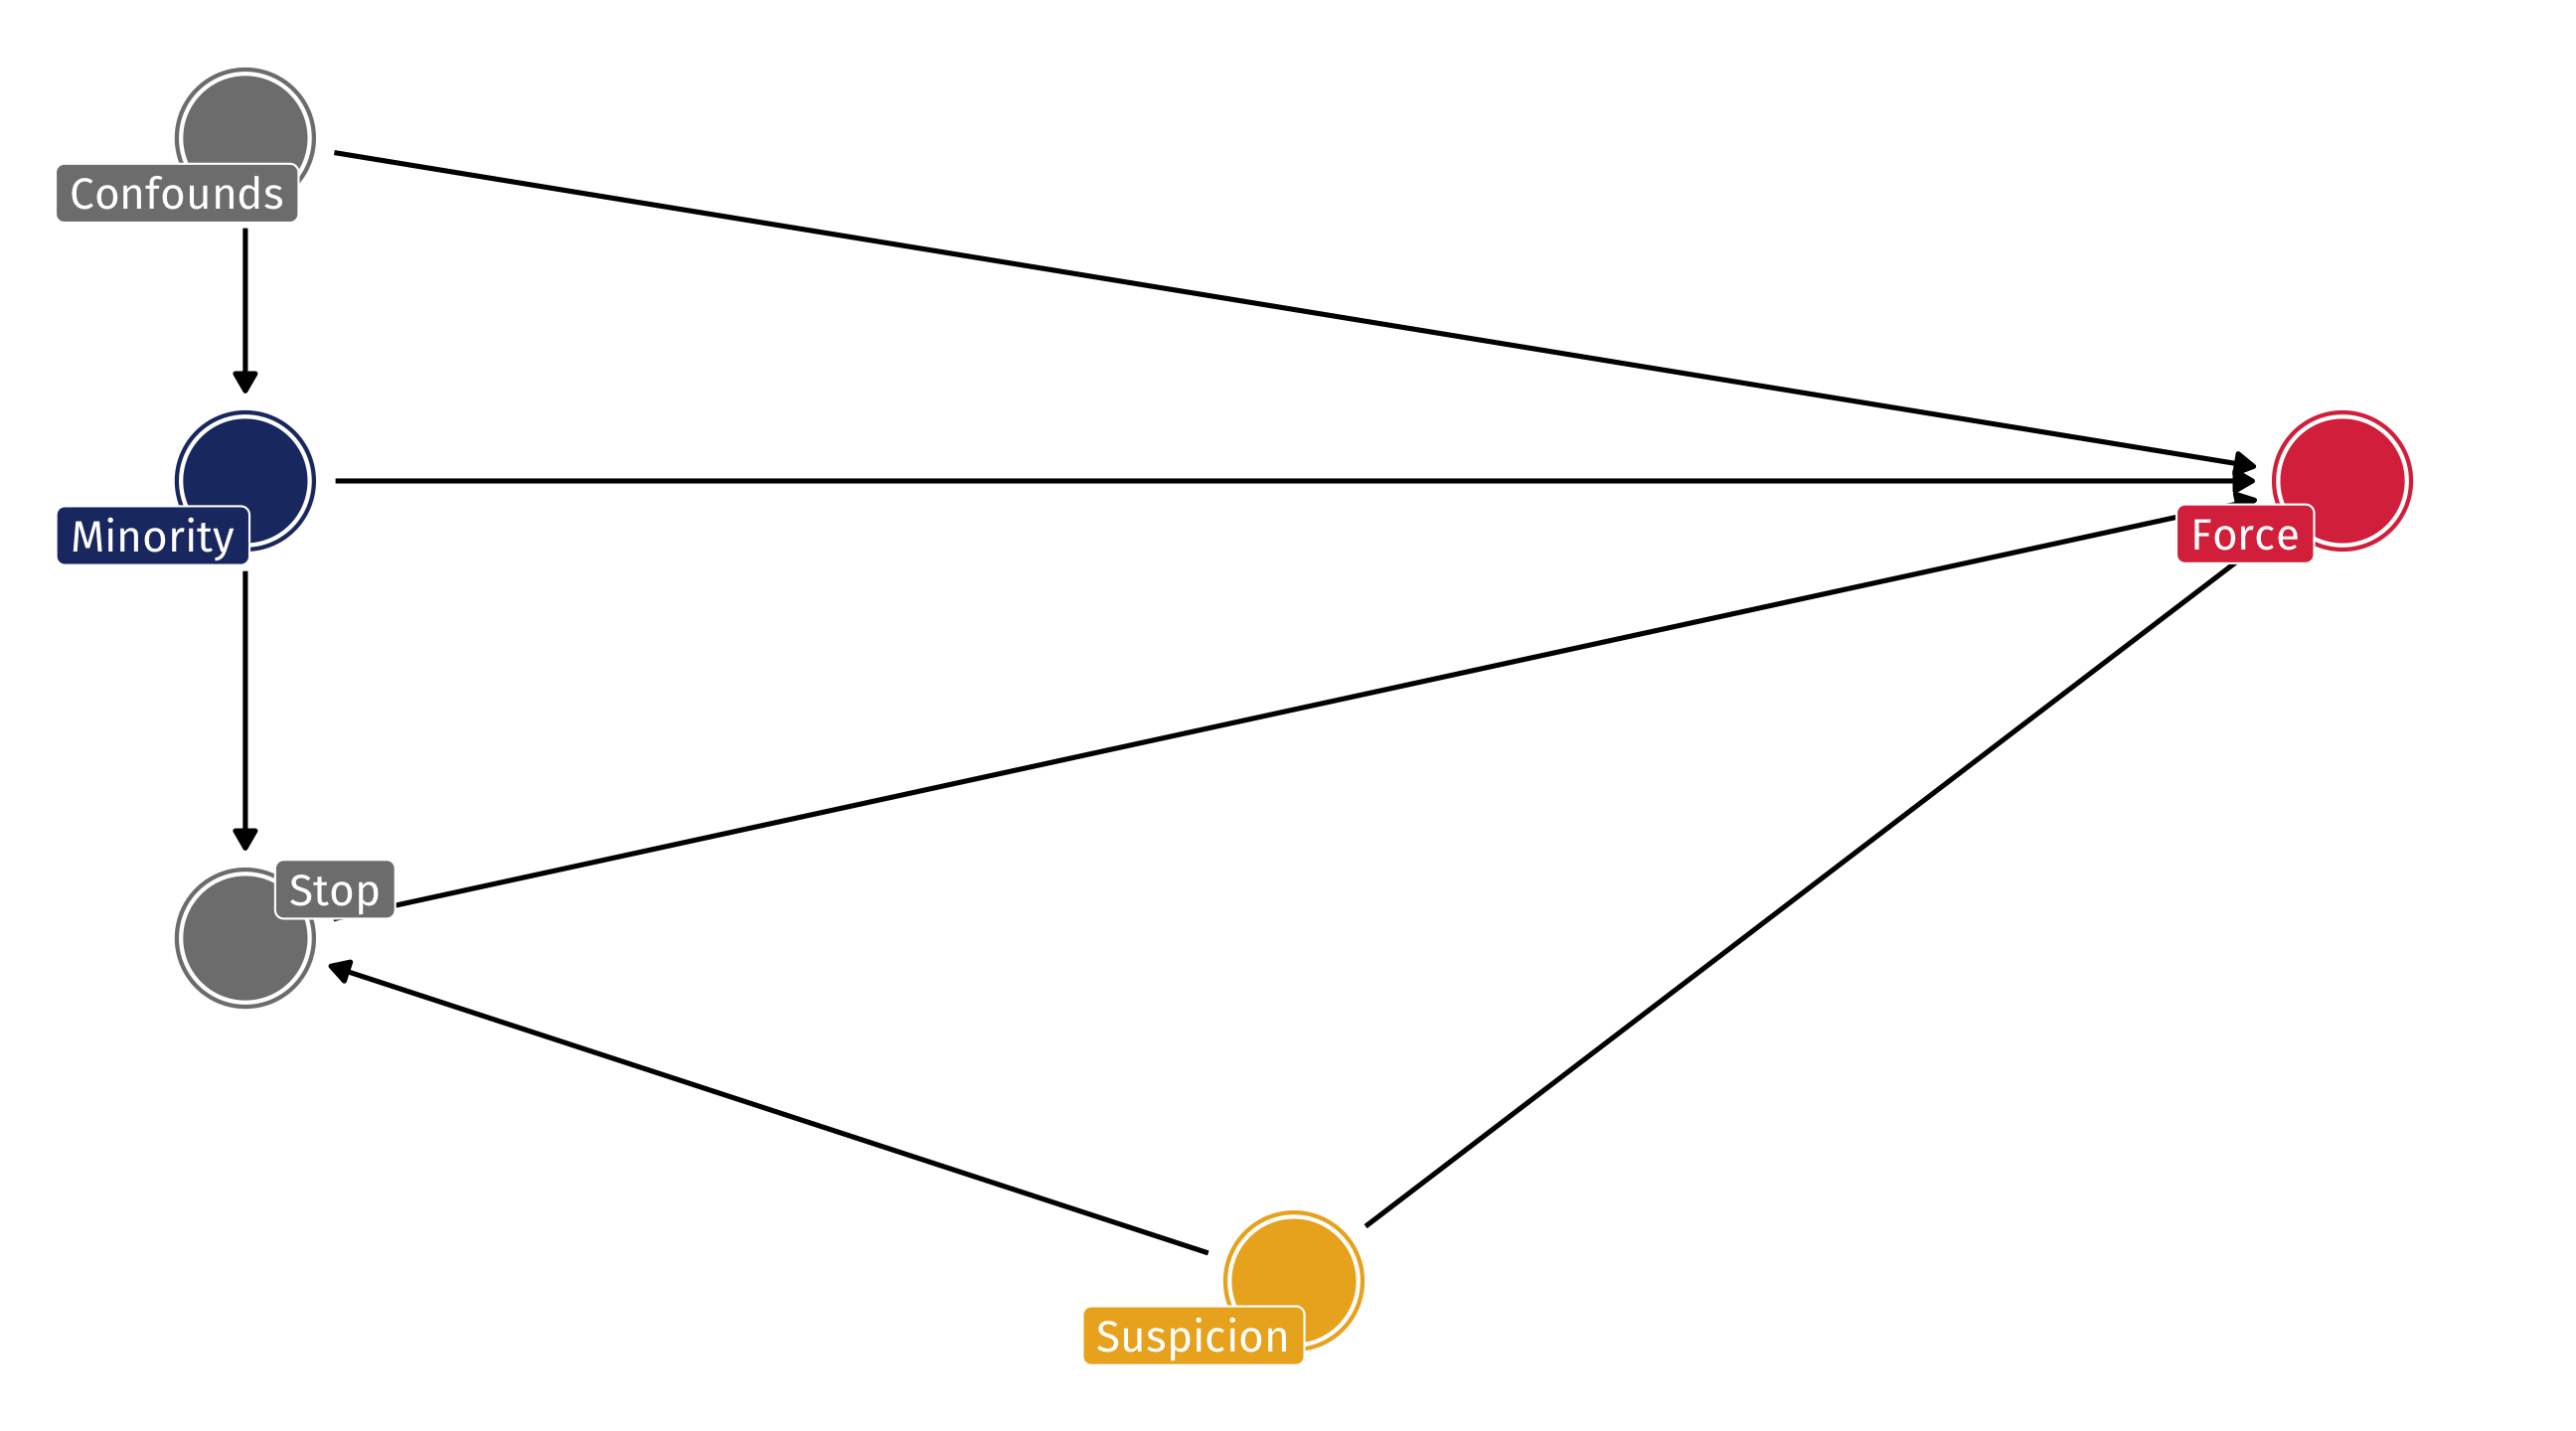
Fryer used extensive controls about the nature of the interaction, time of day, and hundreds of factors that I’ve captured with Confounds
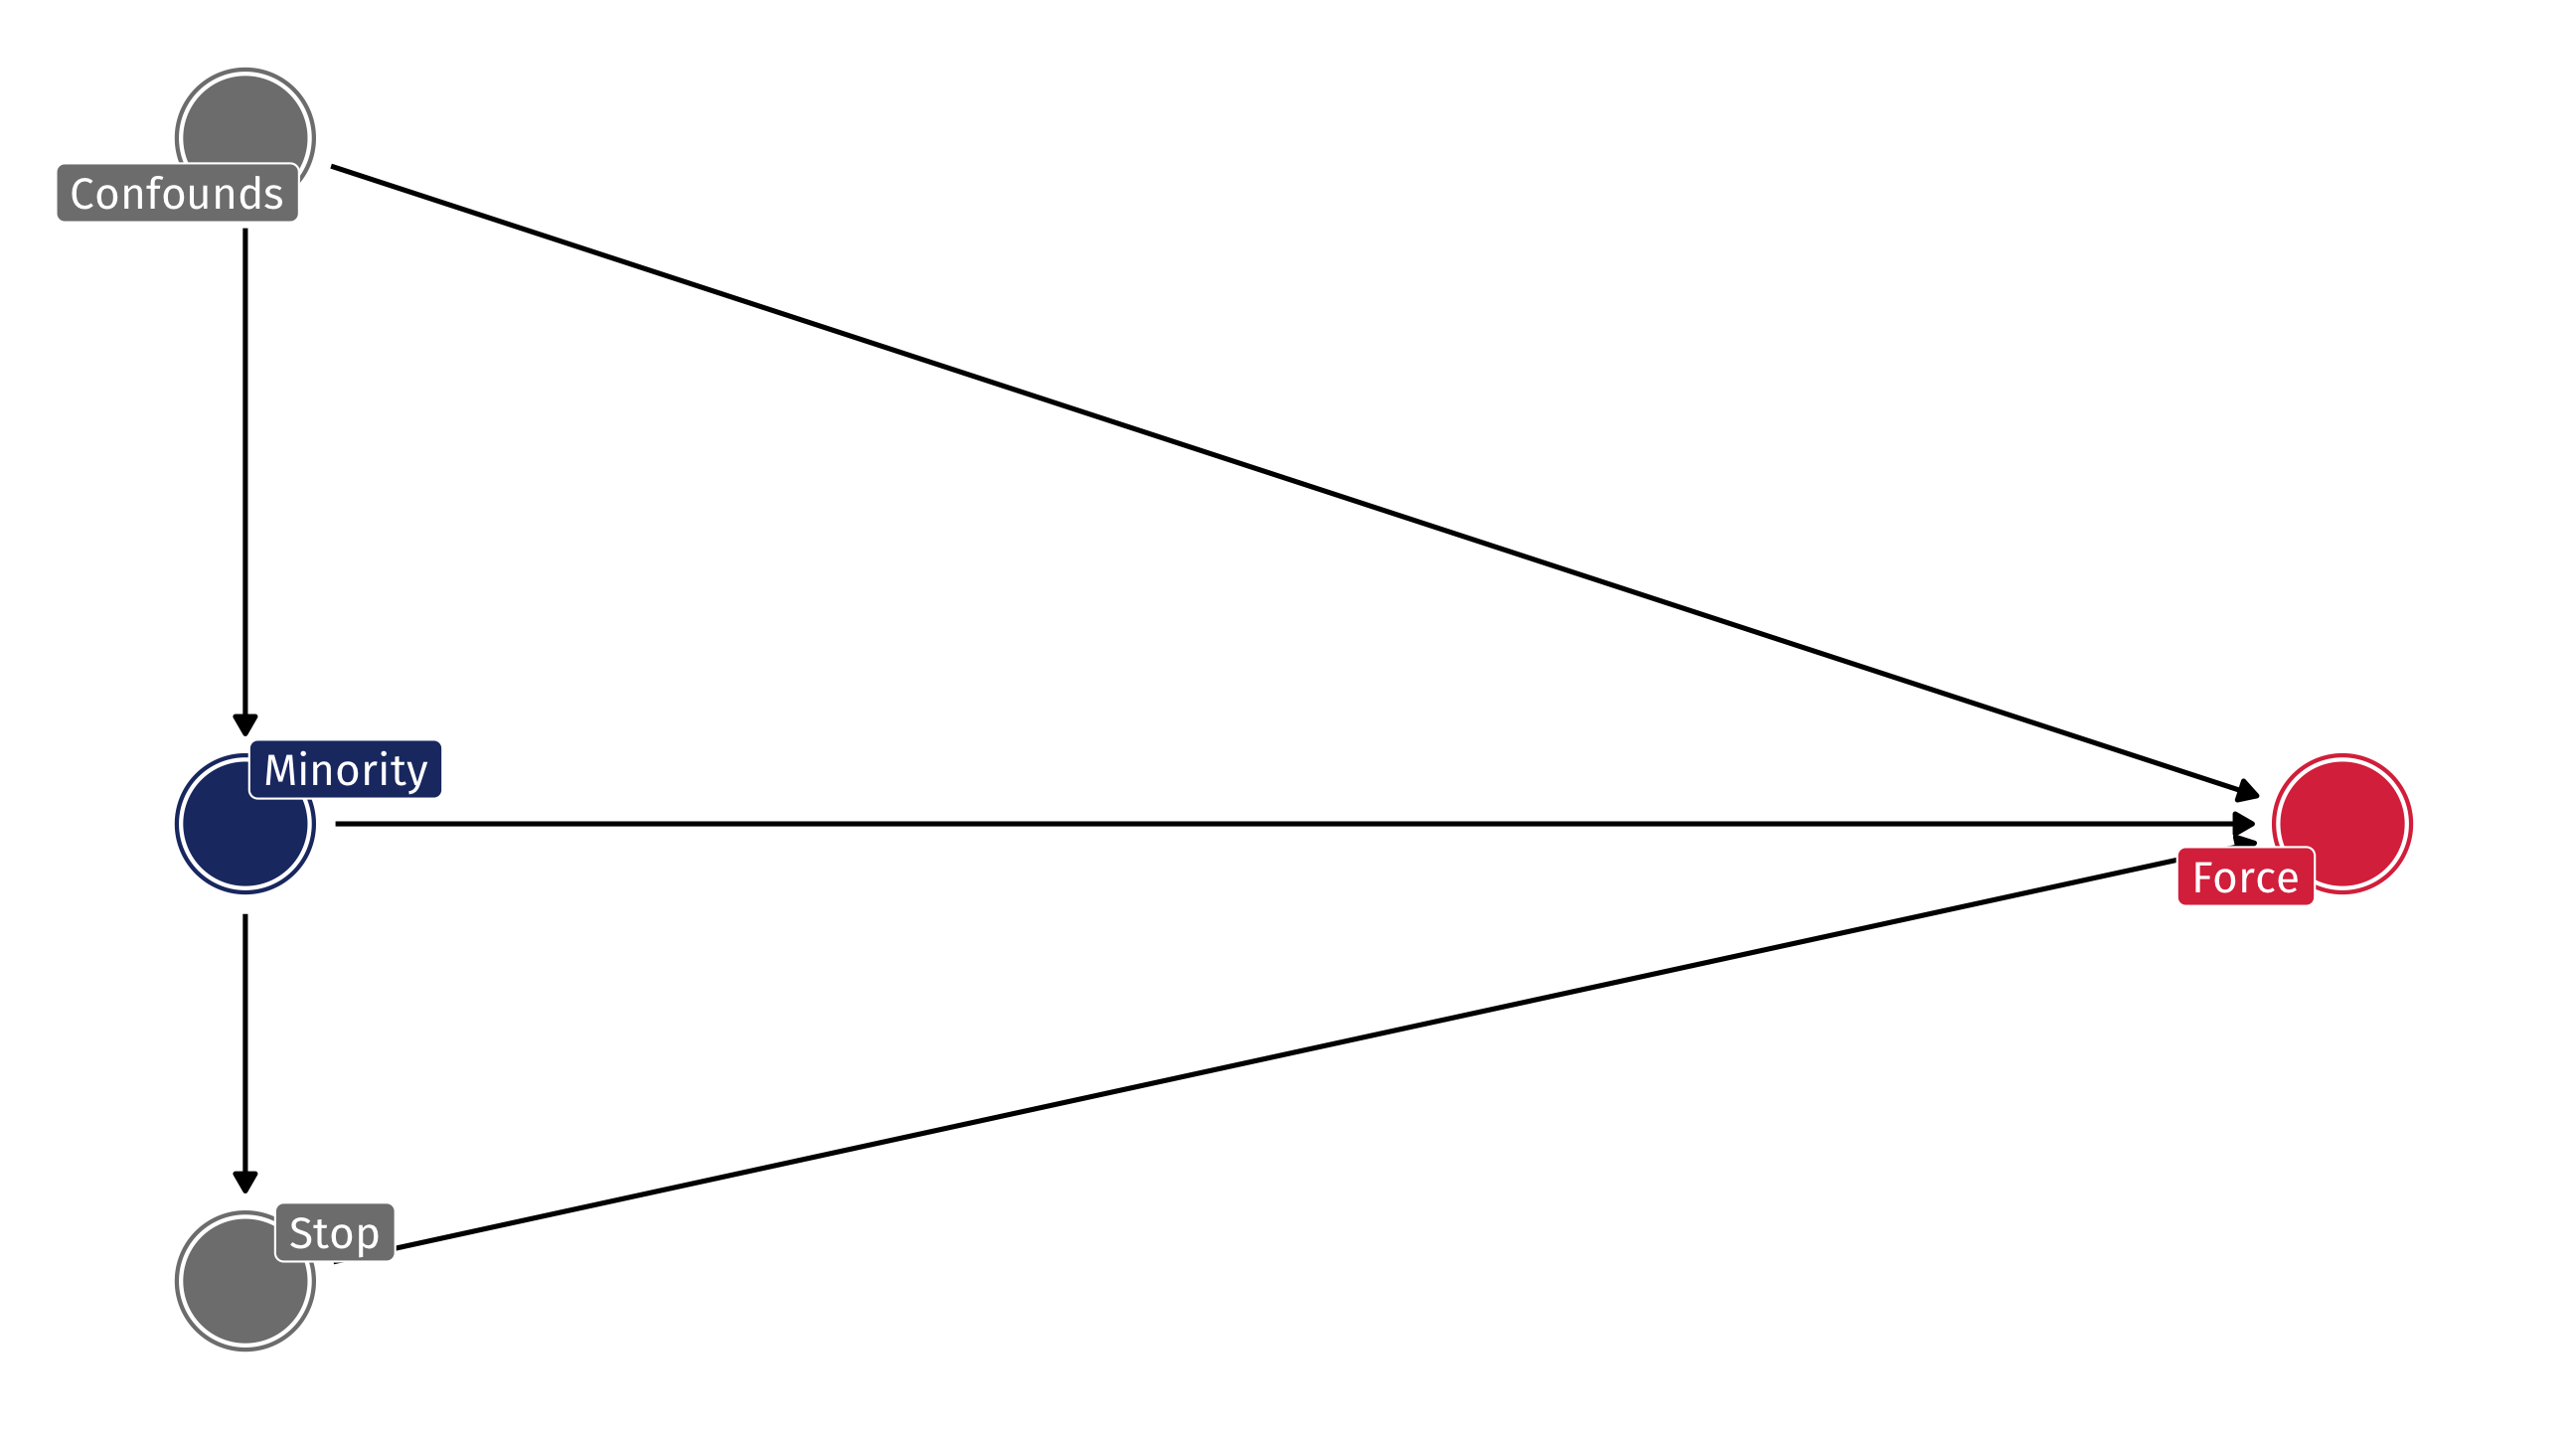
Bias in use of force
Fryer shows that once you account for the indirect effect, the direct effect is basically not there – once the police has stopped someone, they do not use deadly force more often against Minorities than Whites
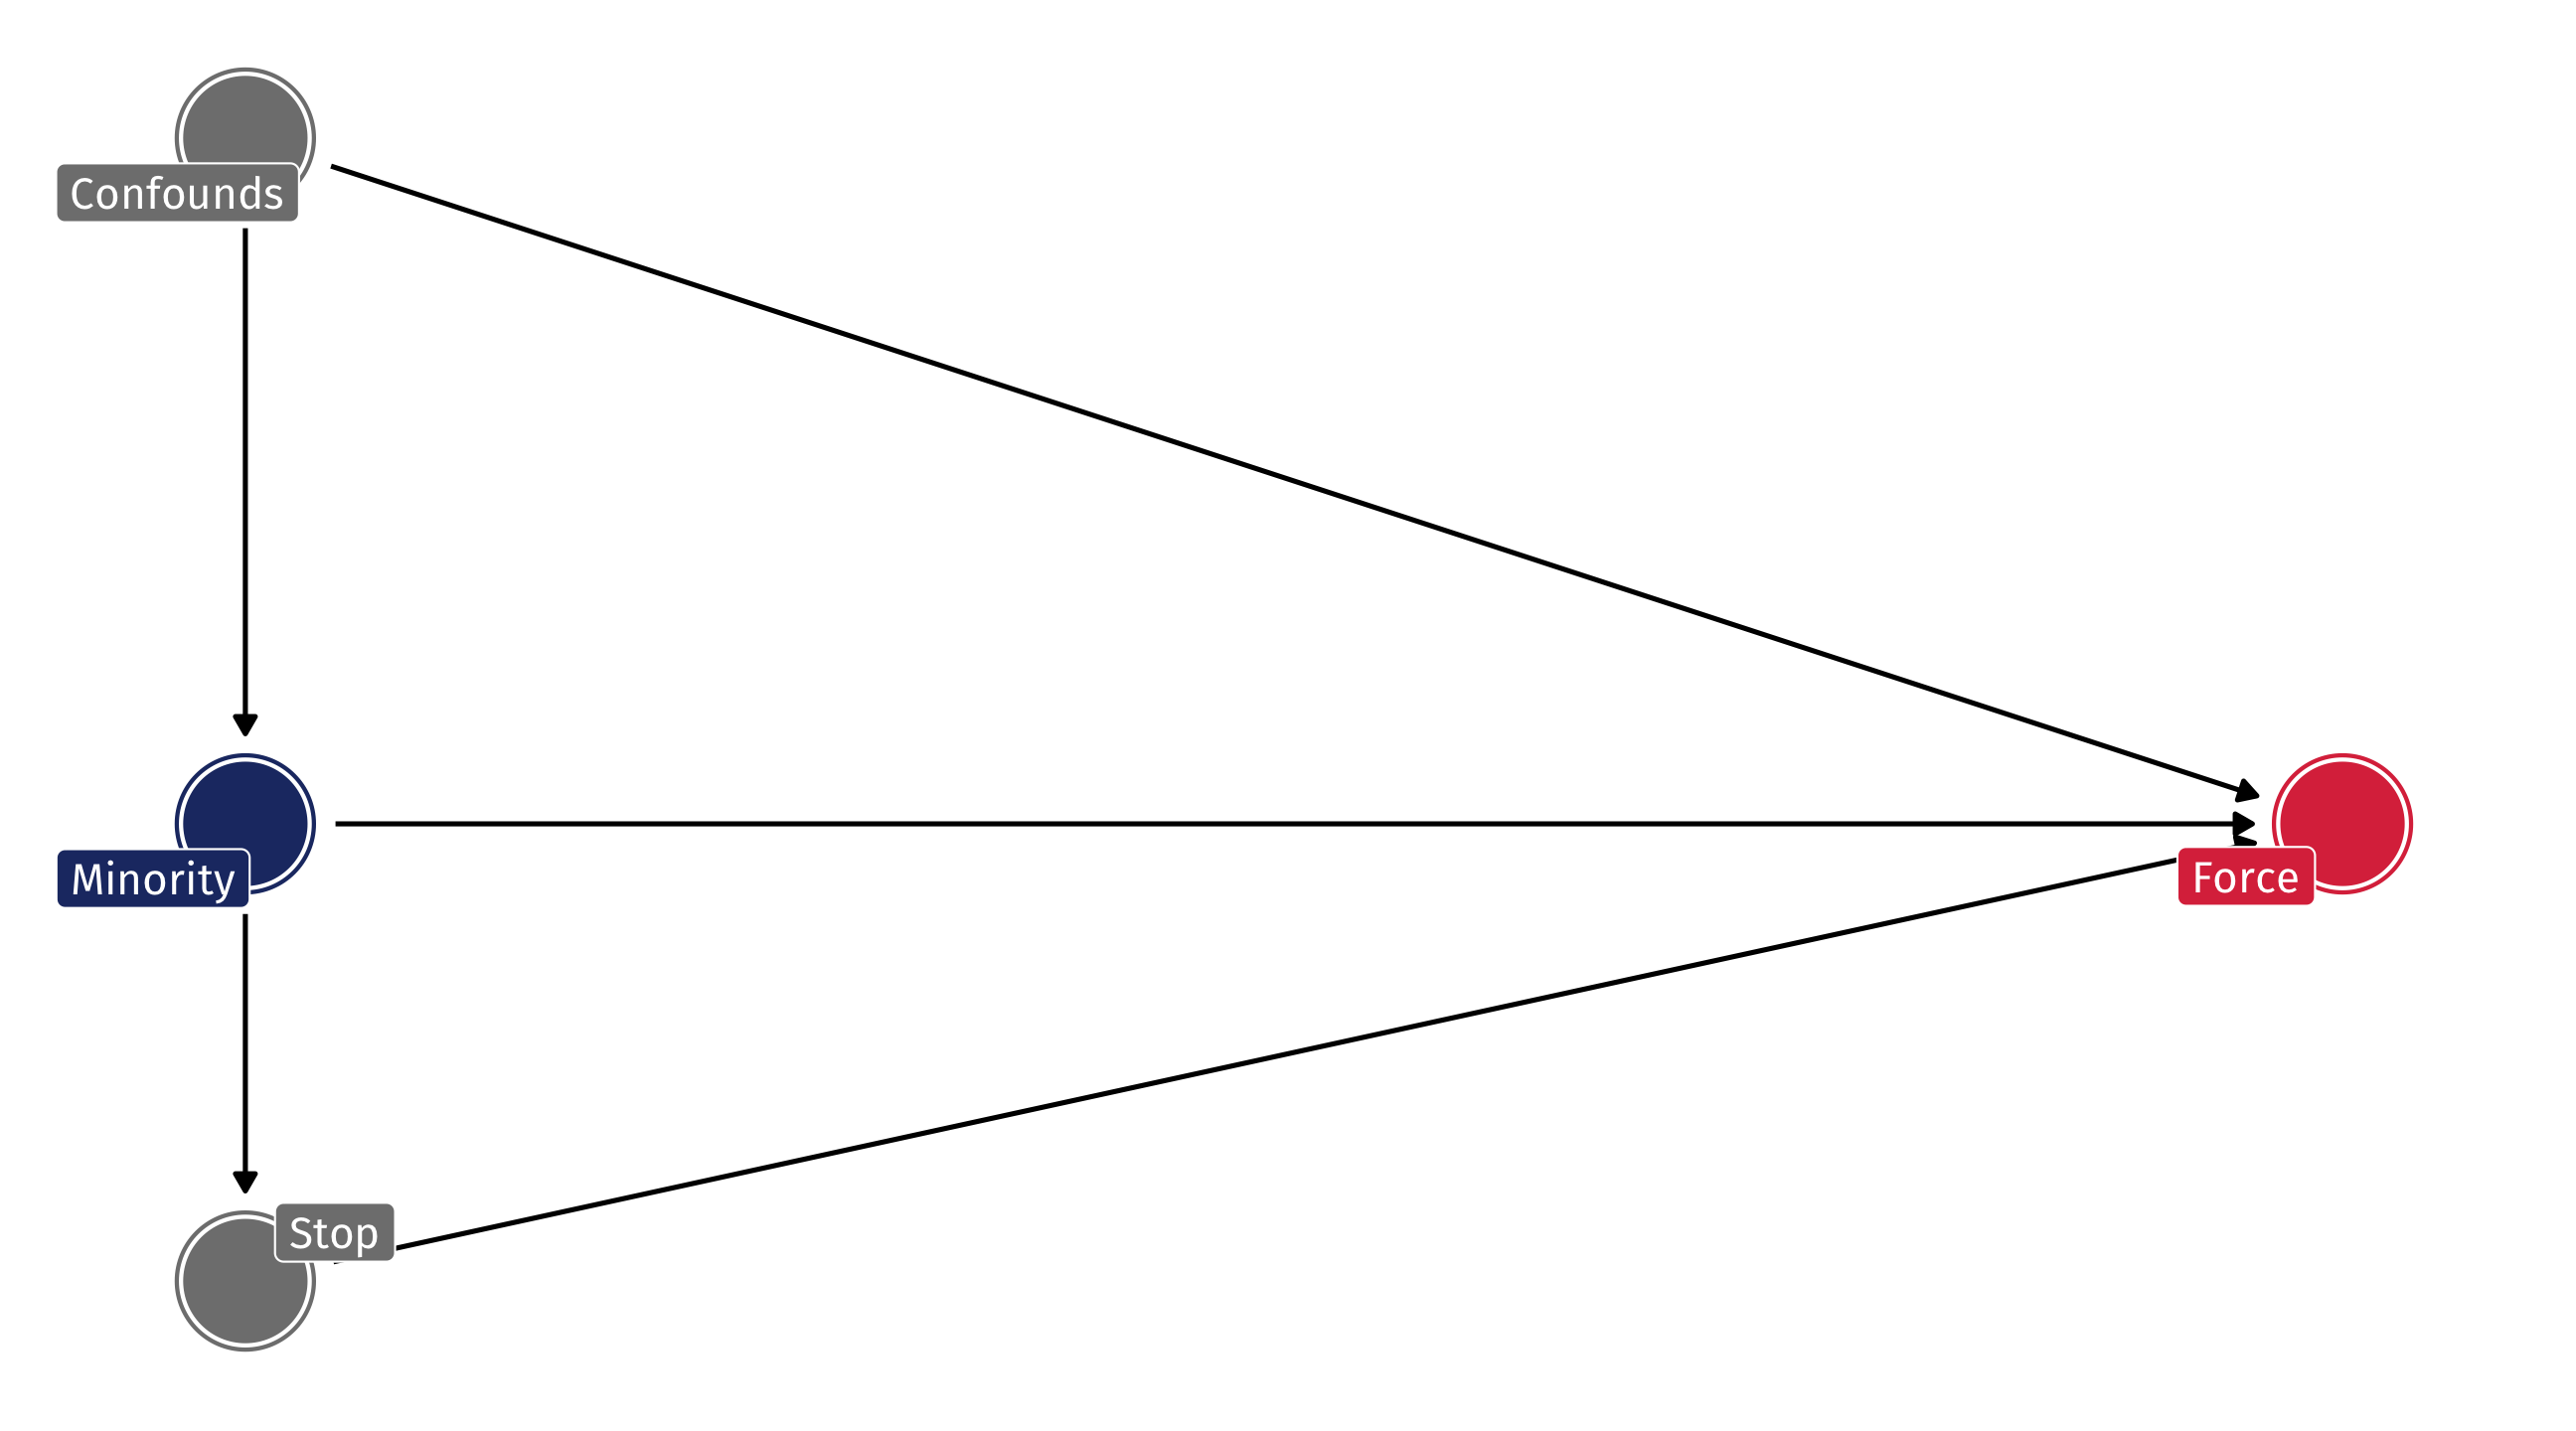
Bias in police use of force
But what if police are more likely to stop people they believe are “suspicious” AND use force against people they find “suspicious”? THEN conditioning on the stop is equivalent to conditioning on a collider
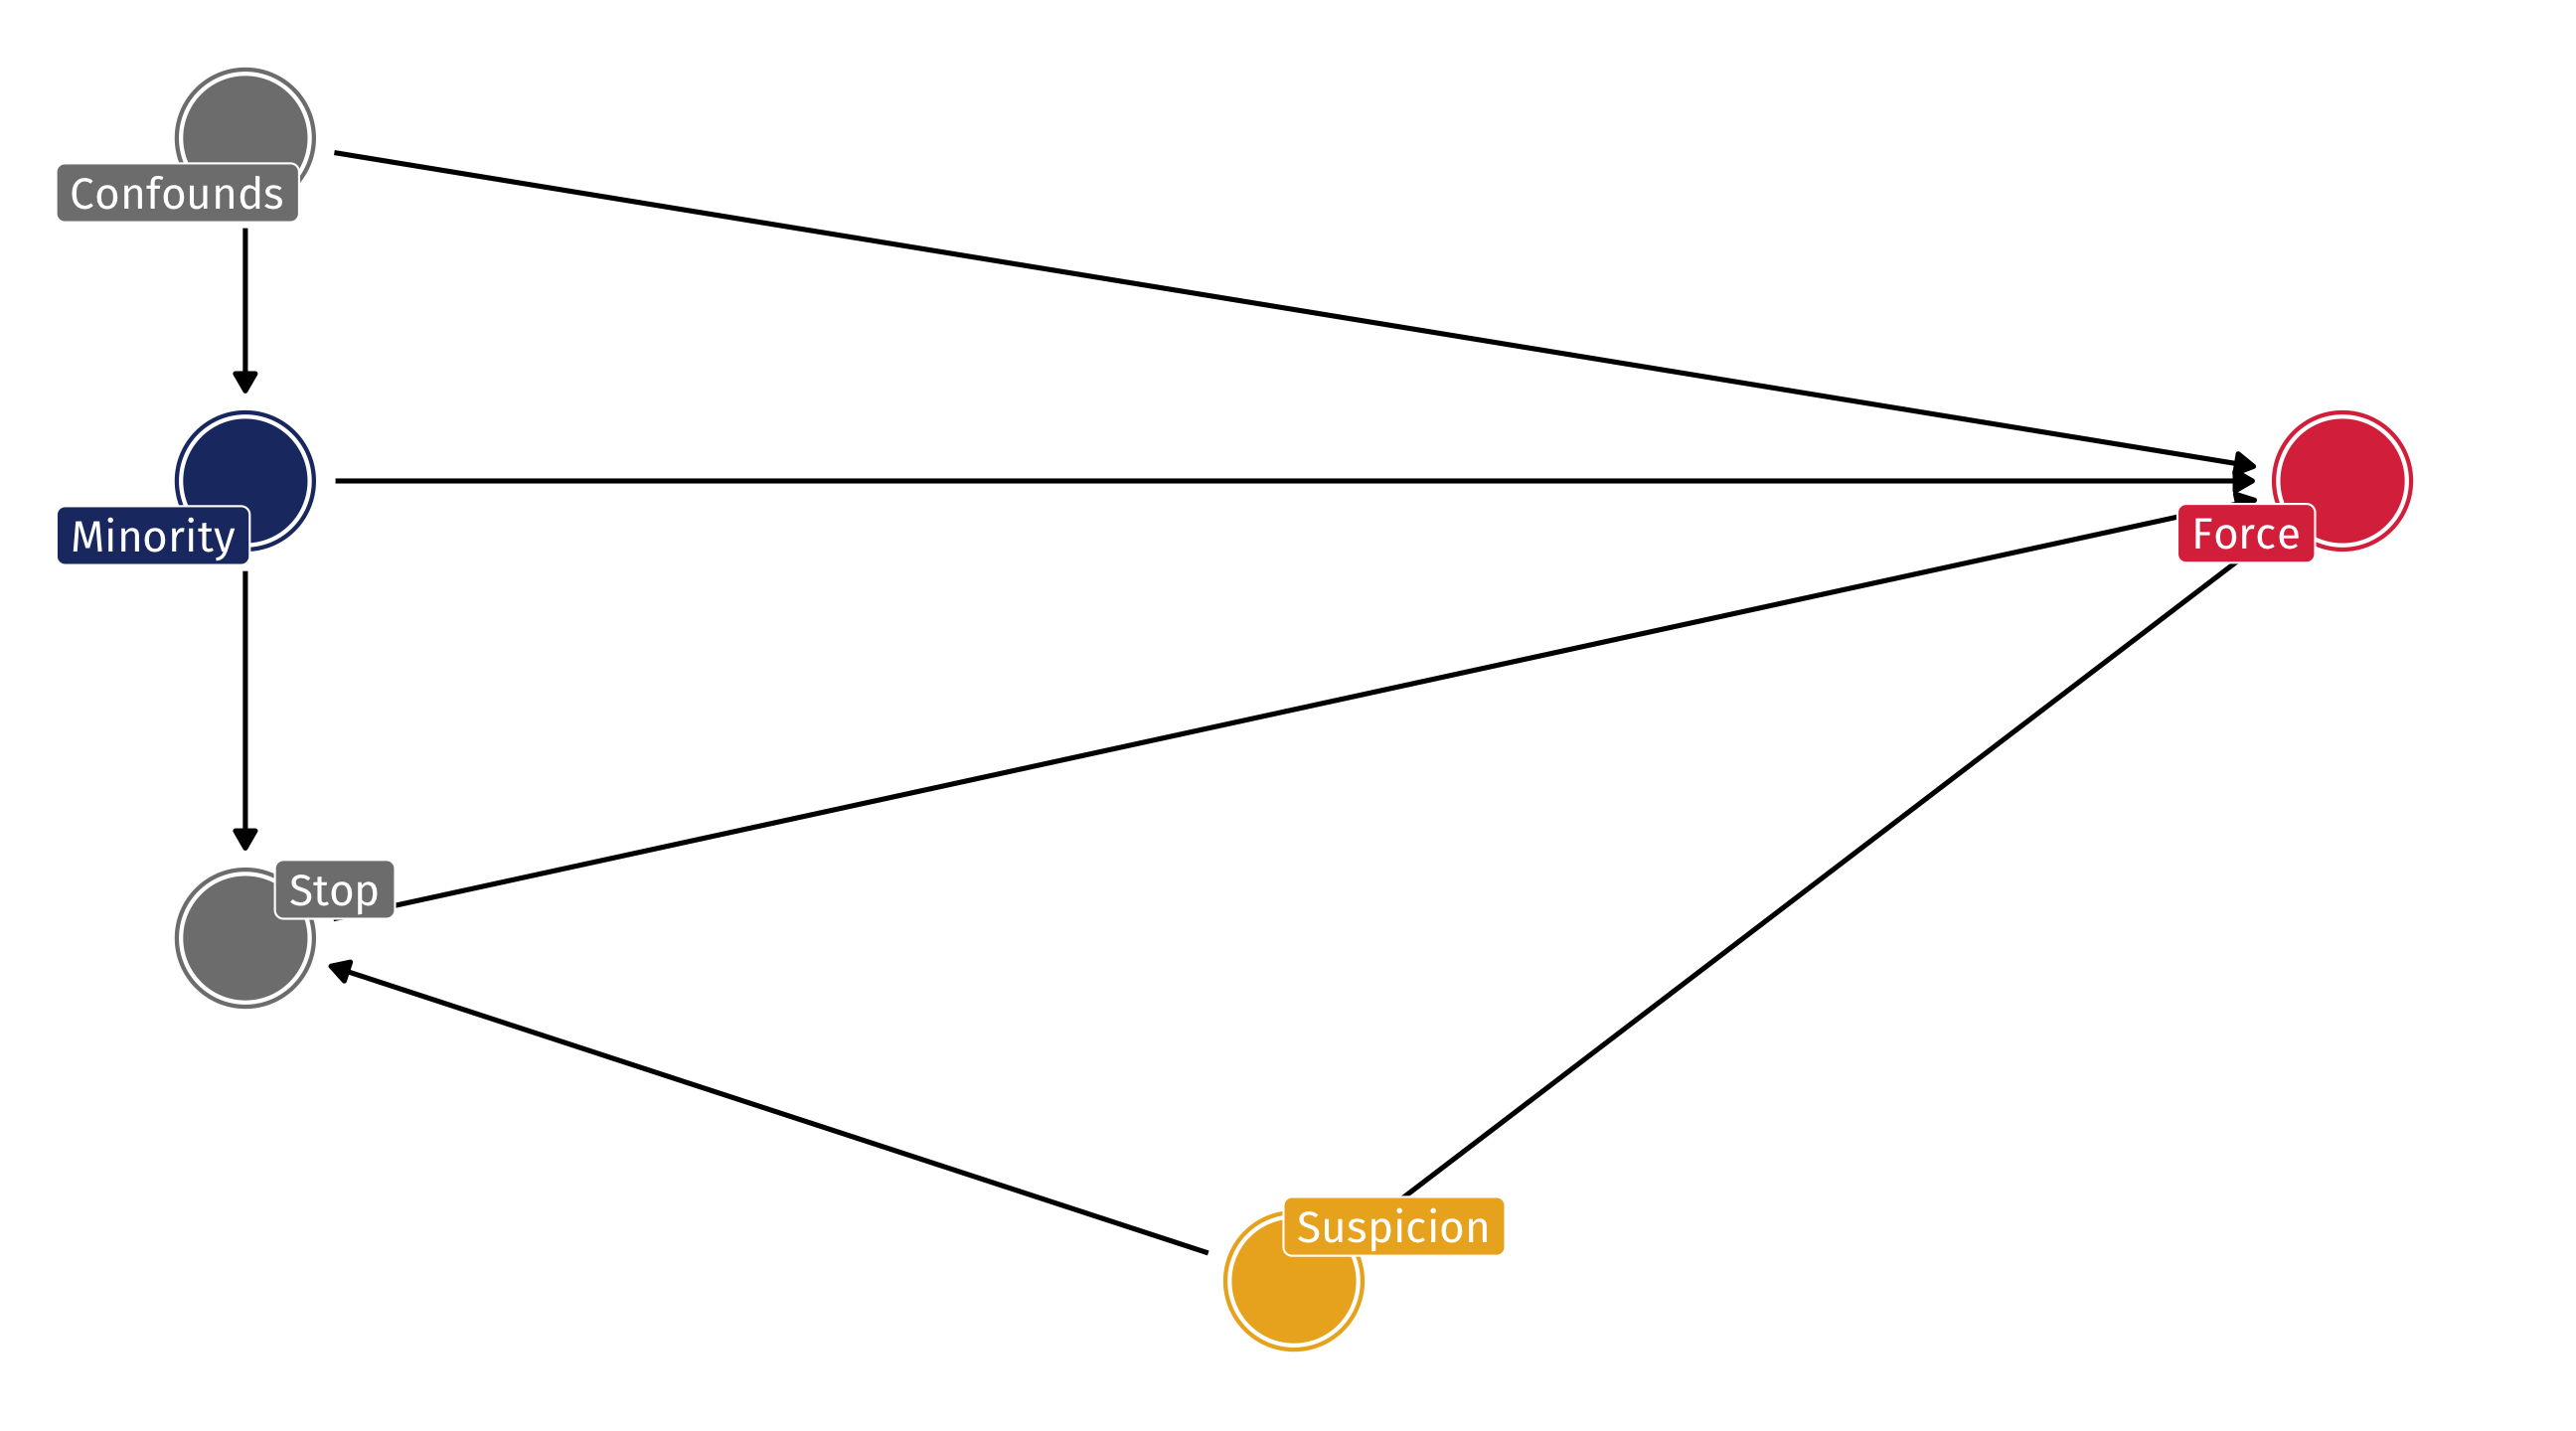
Tough!
We’d like to know if Minorities are killed more than Whites in police interactions once they are stopped
But controlling for being stopped creates collider bias
Super tough to estimate the effect of race ➡️ police abuse with observational data!
Why experiments work
Experiments seem simple…
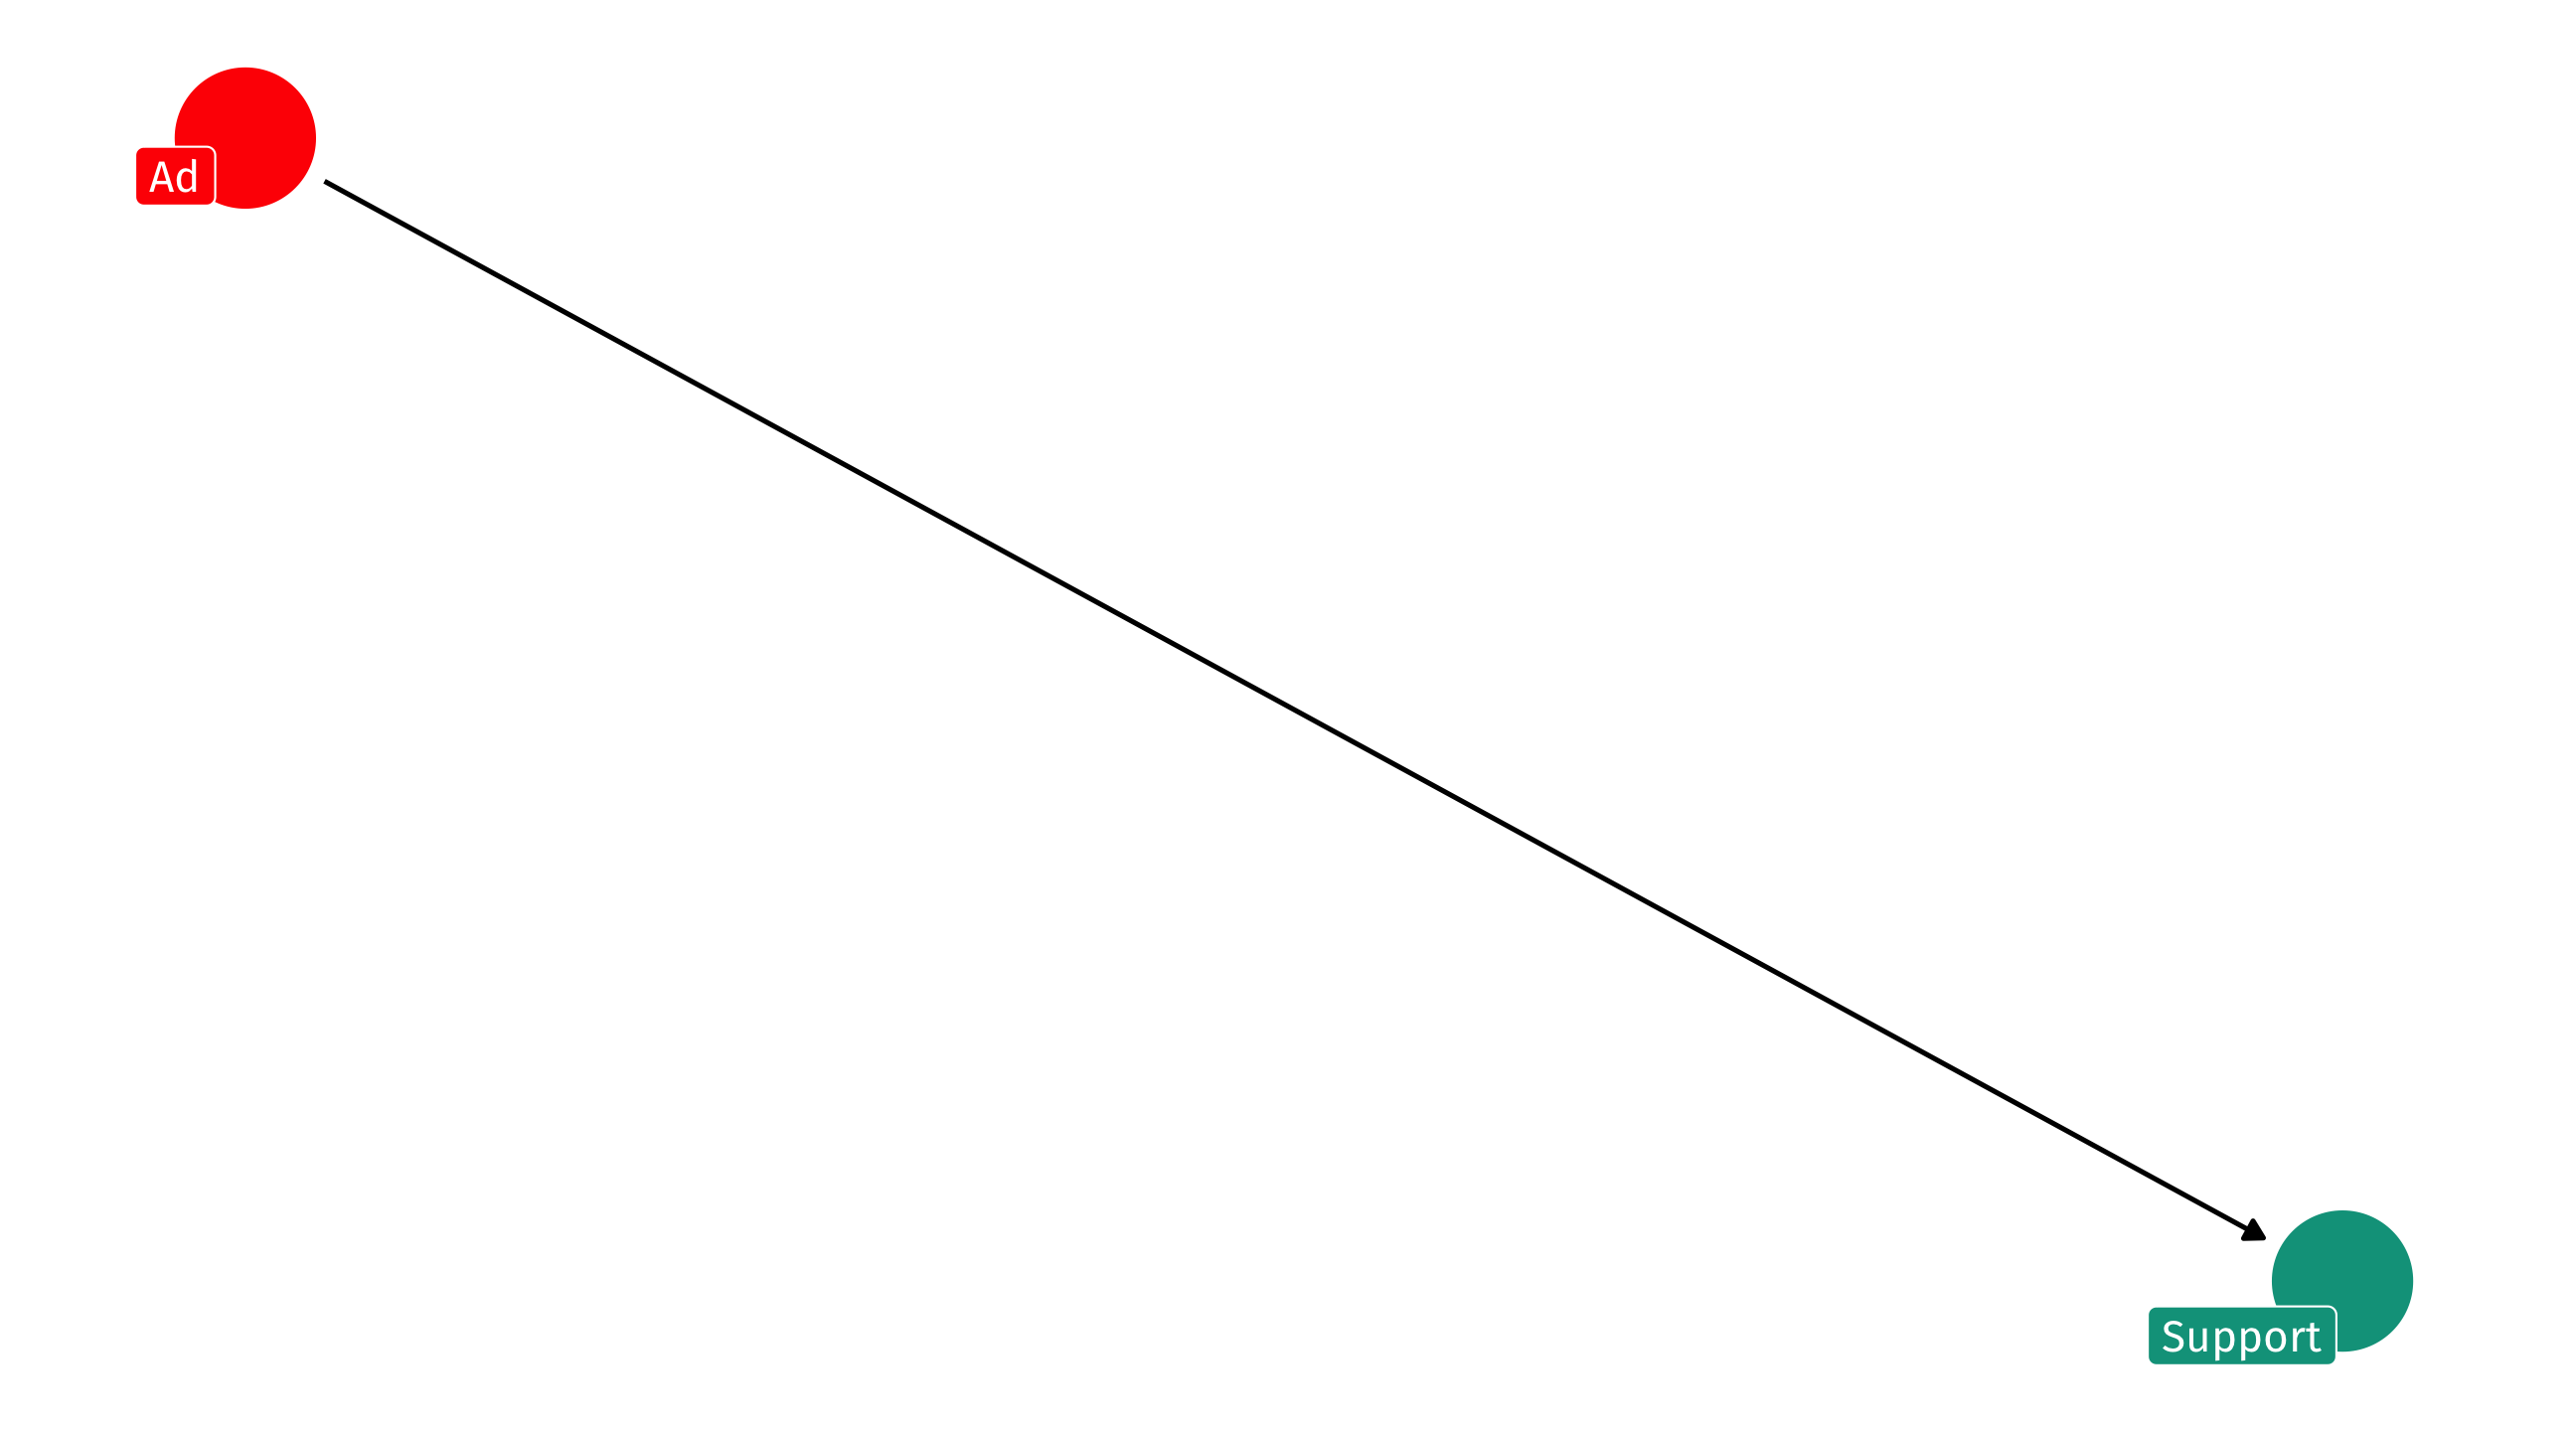
Why experiments work
But the outcome can be very complex …
And yet we can still identify the effect because nothing causes you to receive the experimental treatment; it is random!
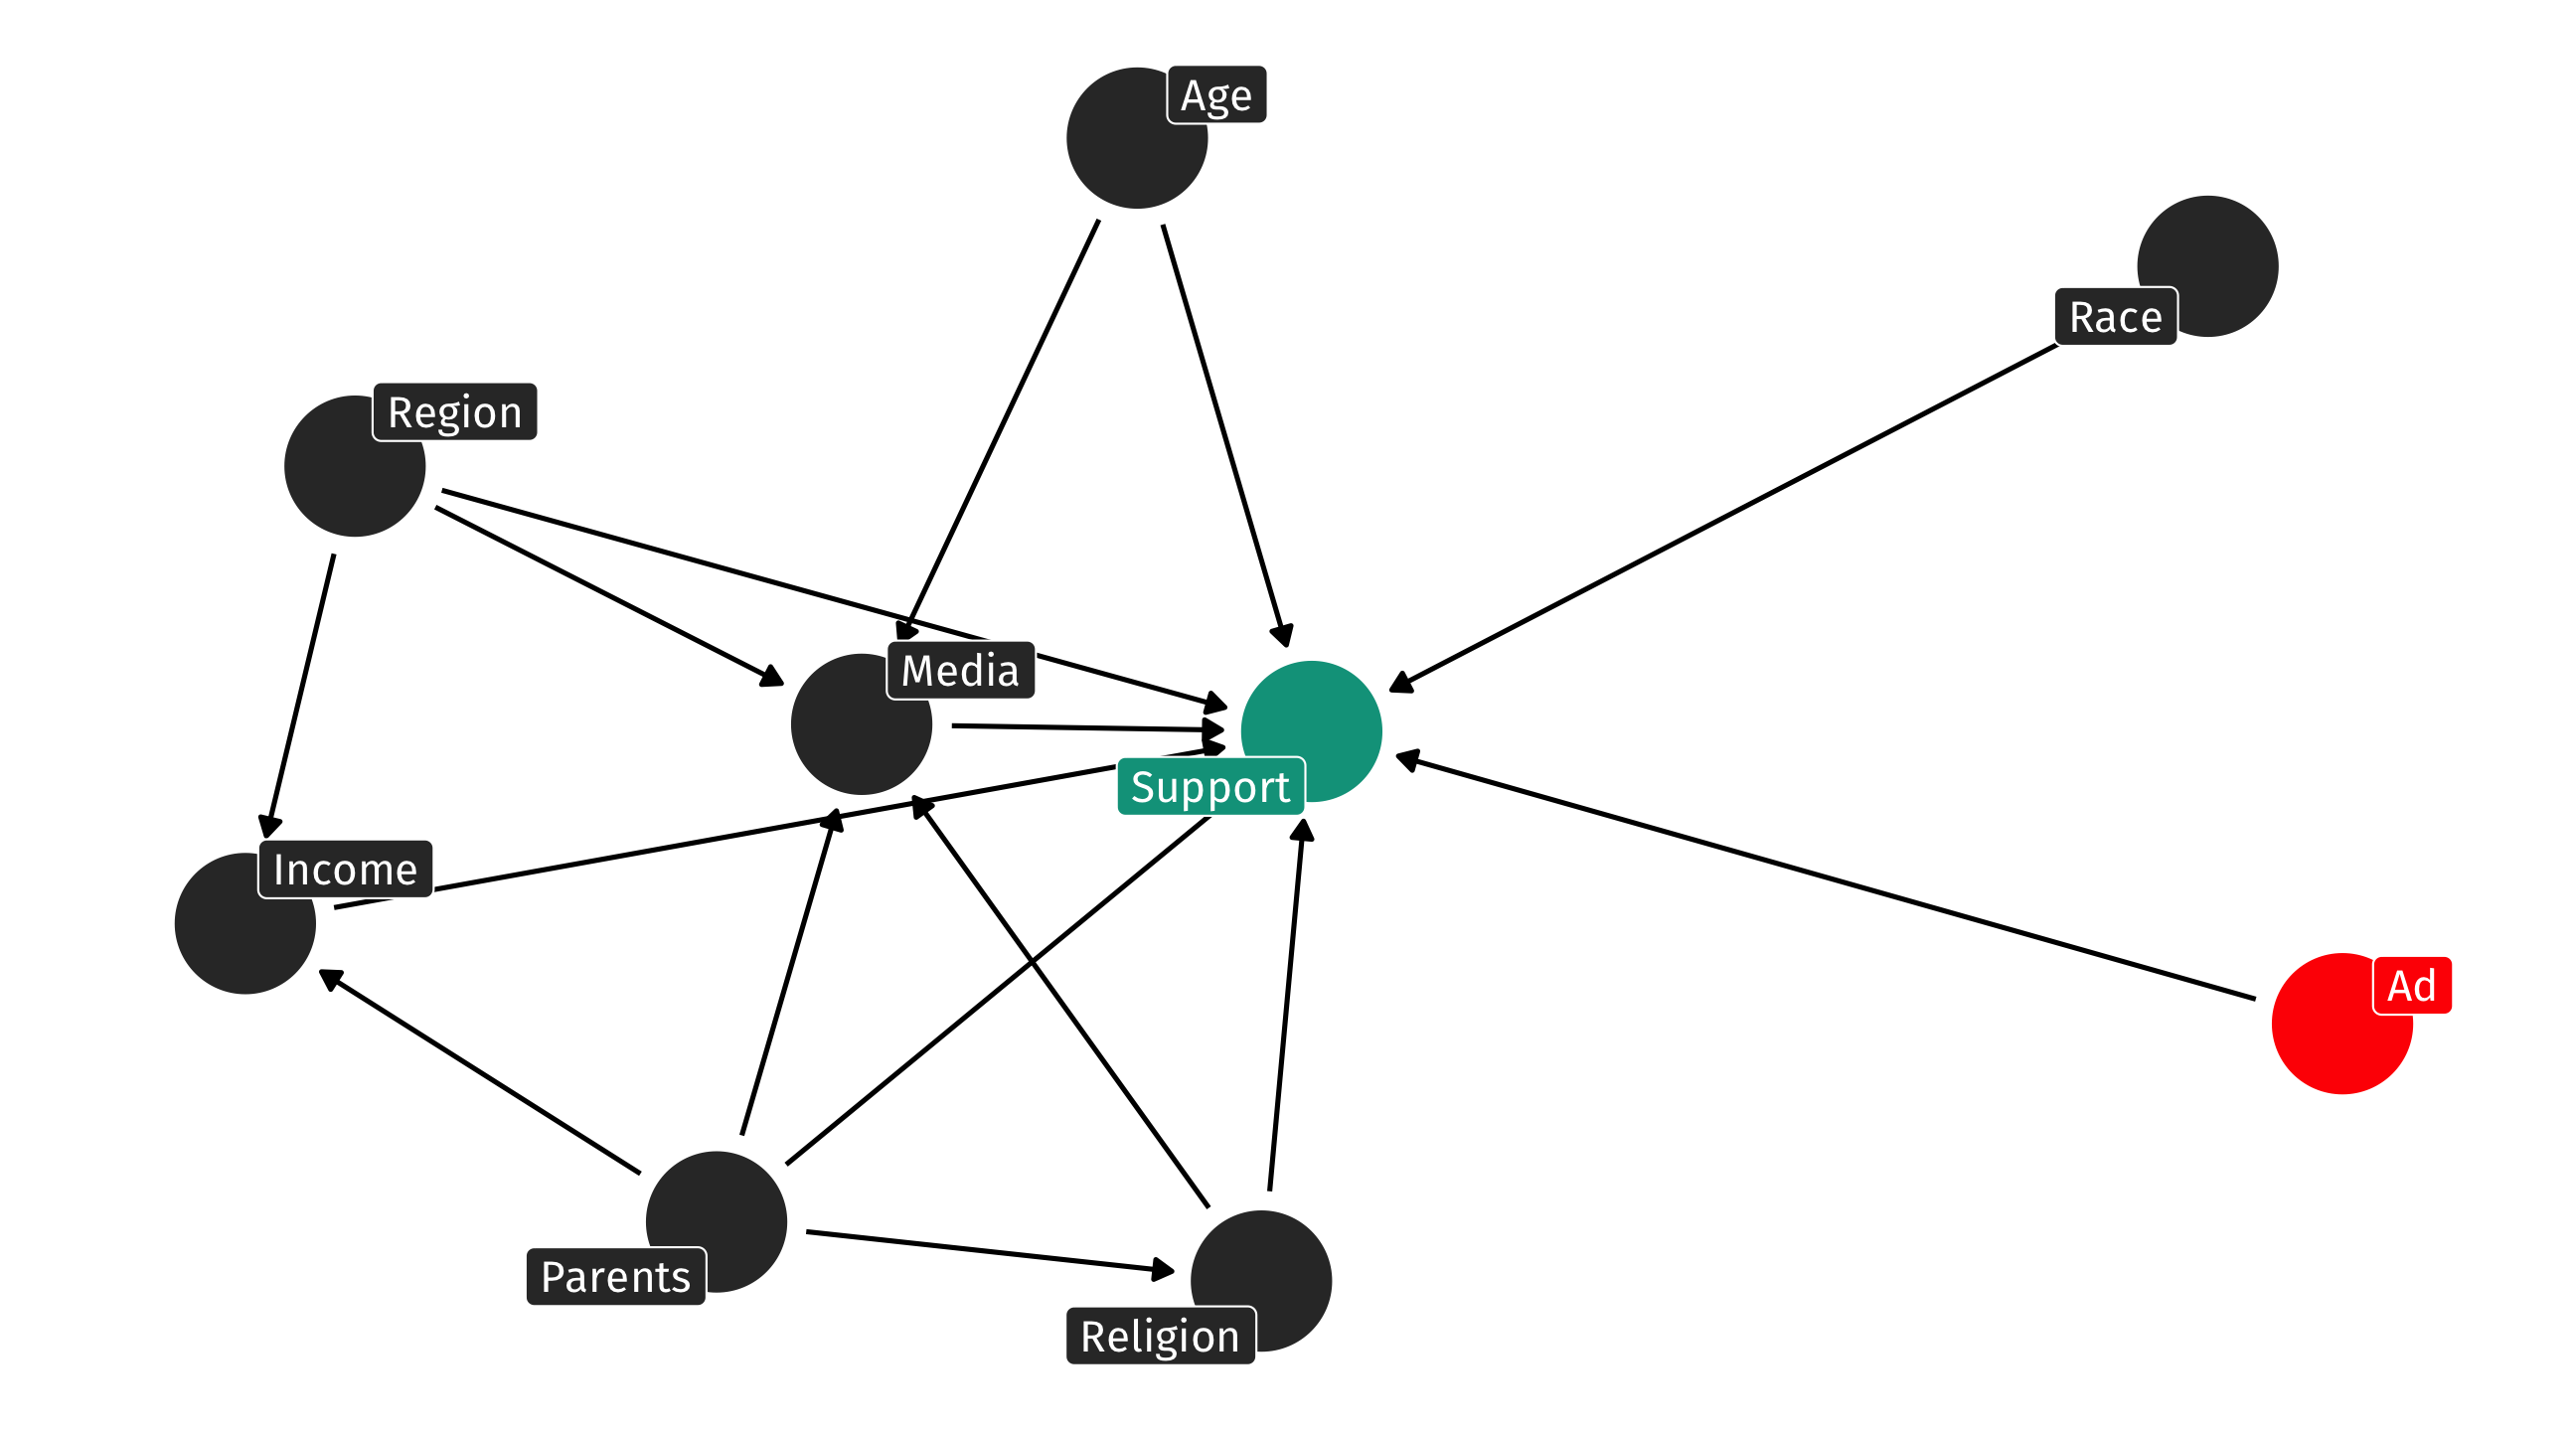
When experiments go wrong
Say the ad experiment was implemented on TikTok, and younger people are more likely to use TikTok than older people
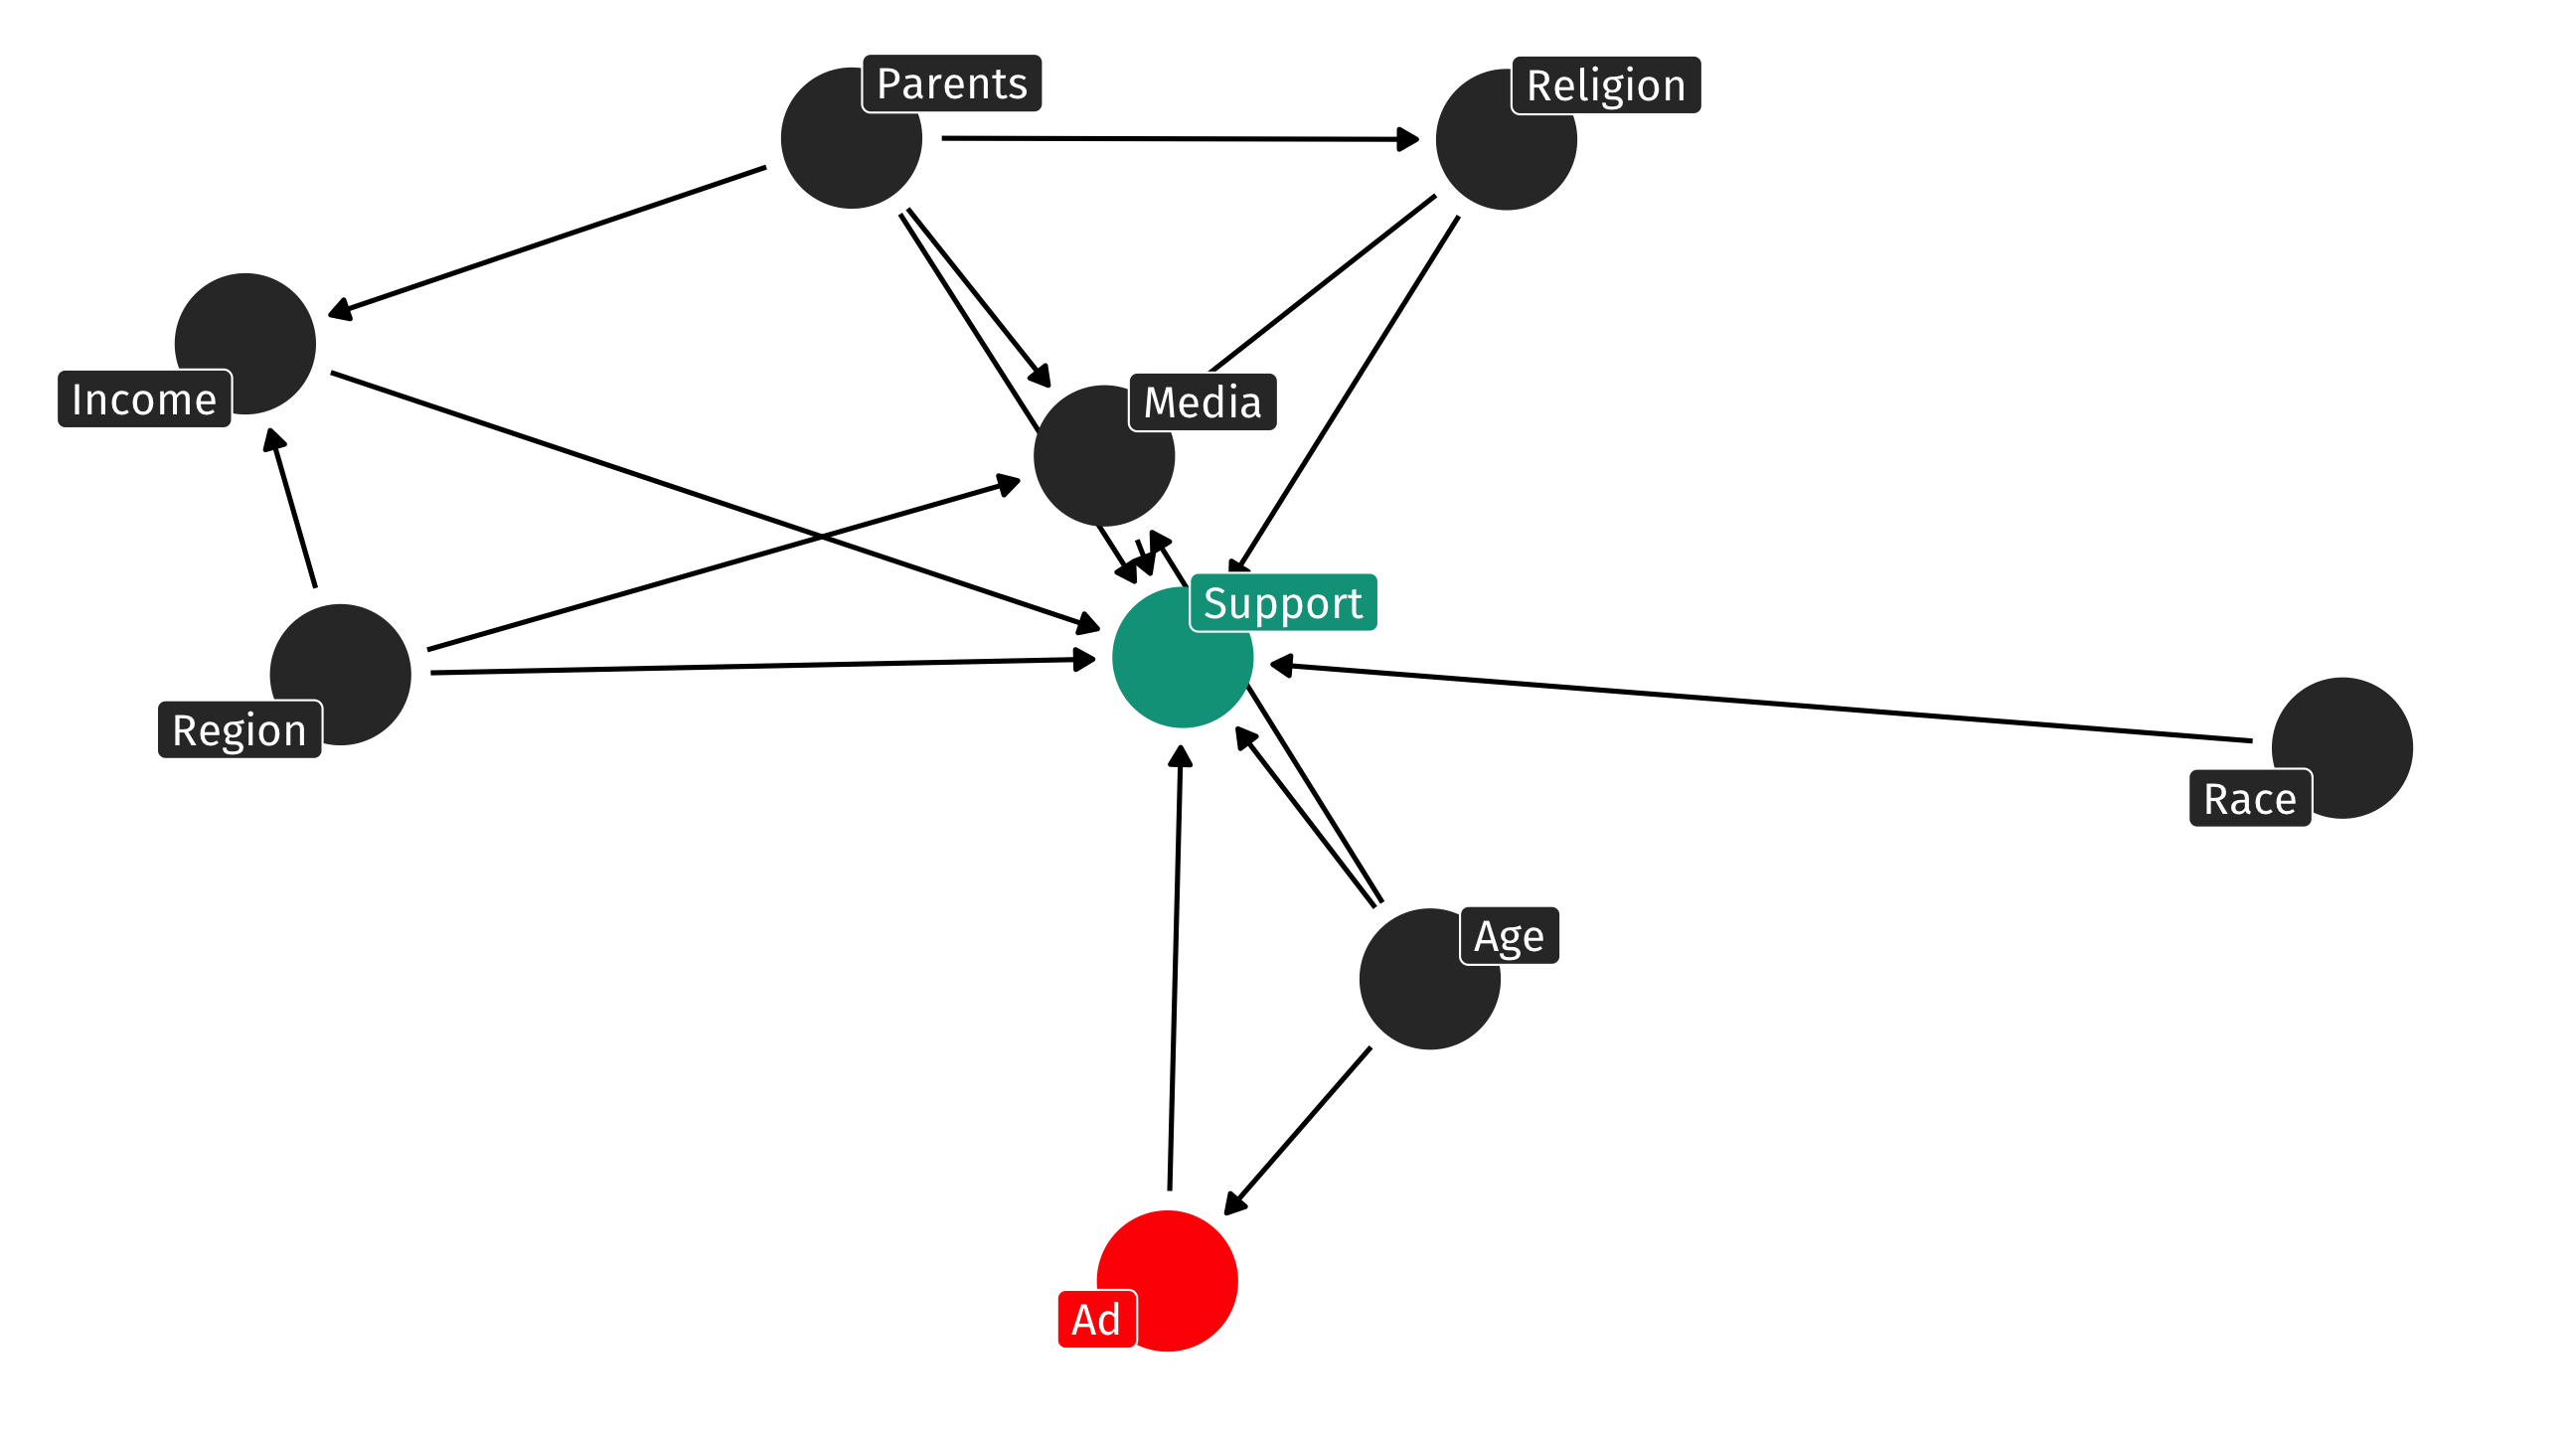
This means Age is now a fork
Front-doors and back-doors
Judea Pearl’s back-door criterion ties this all together
Confounding caused by existence of an open “back door” path from X to Y
A backdoor path is a non-causal path from X to Y
Need to close back-doors and keep front-doors open

Backdoor paths
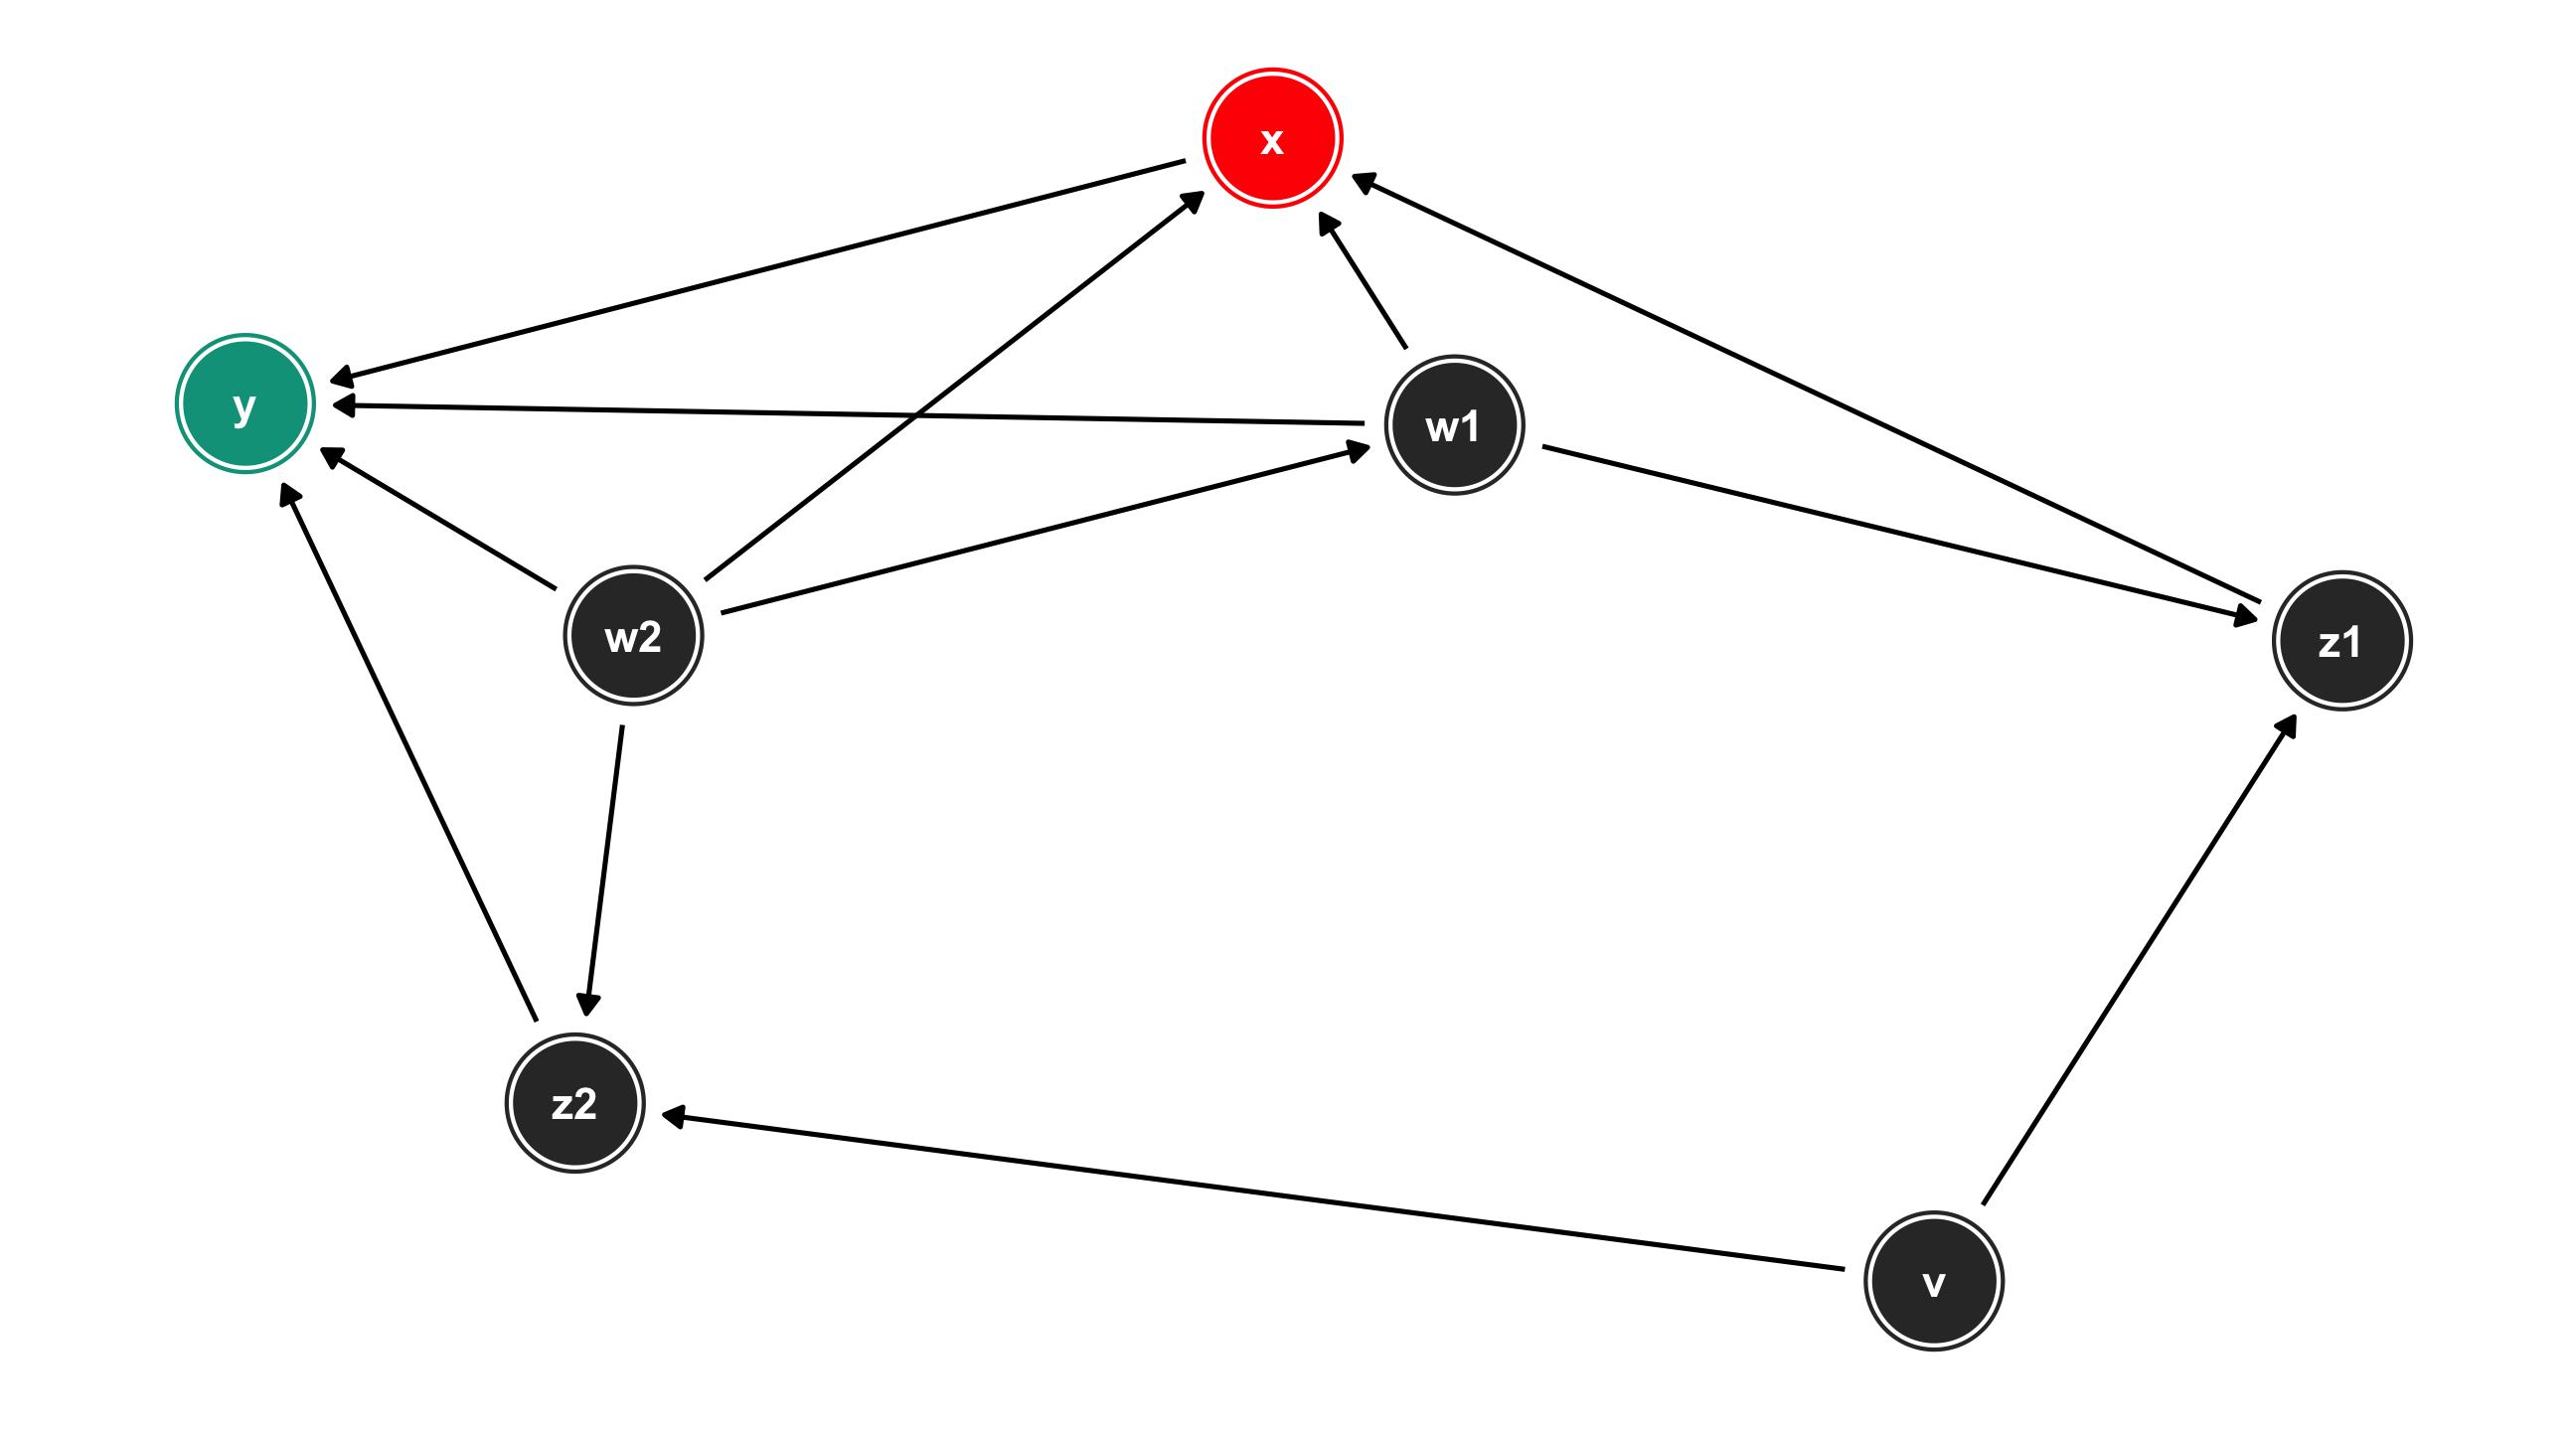
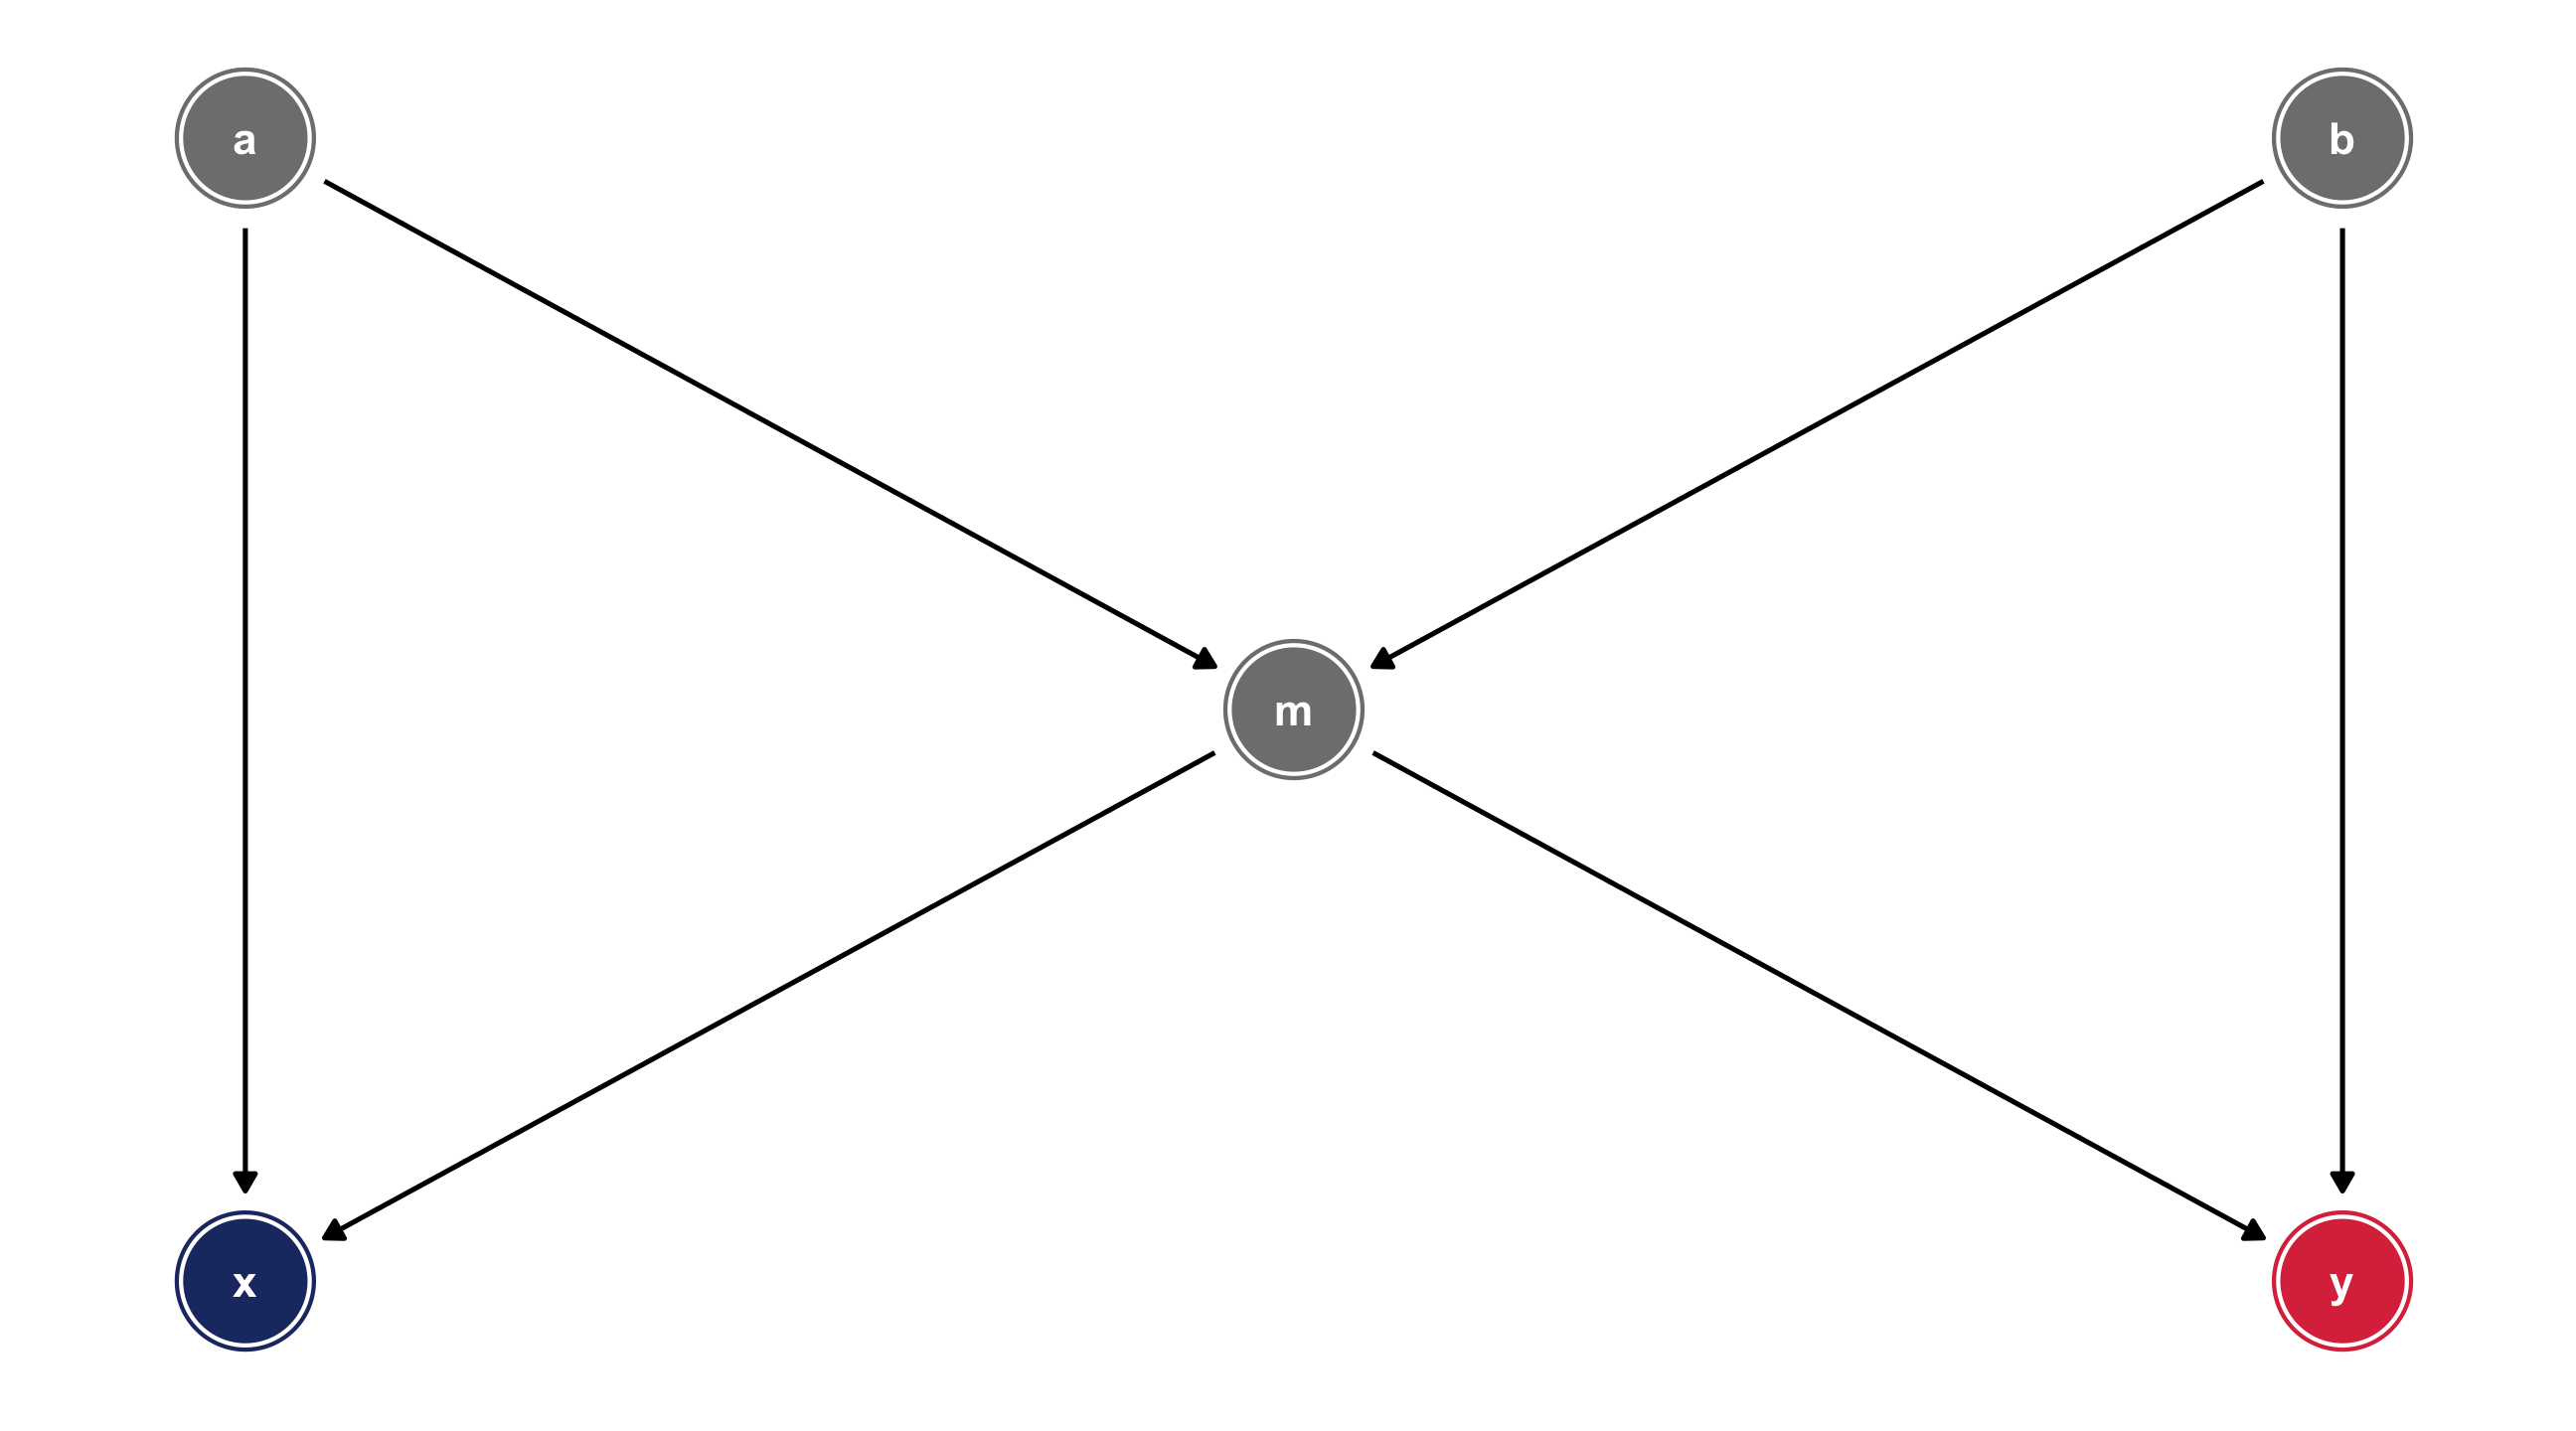
A backdoor path can involve a chain of variables – like the fork, but with more steps
Here we have a backdoor path between X and Y that runs through a, b, and m
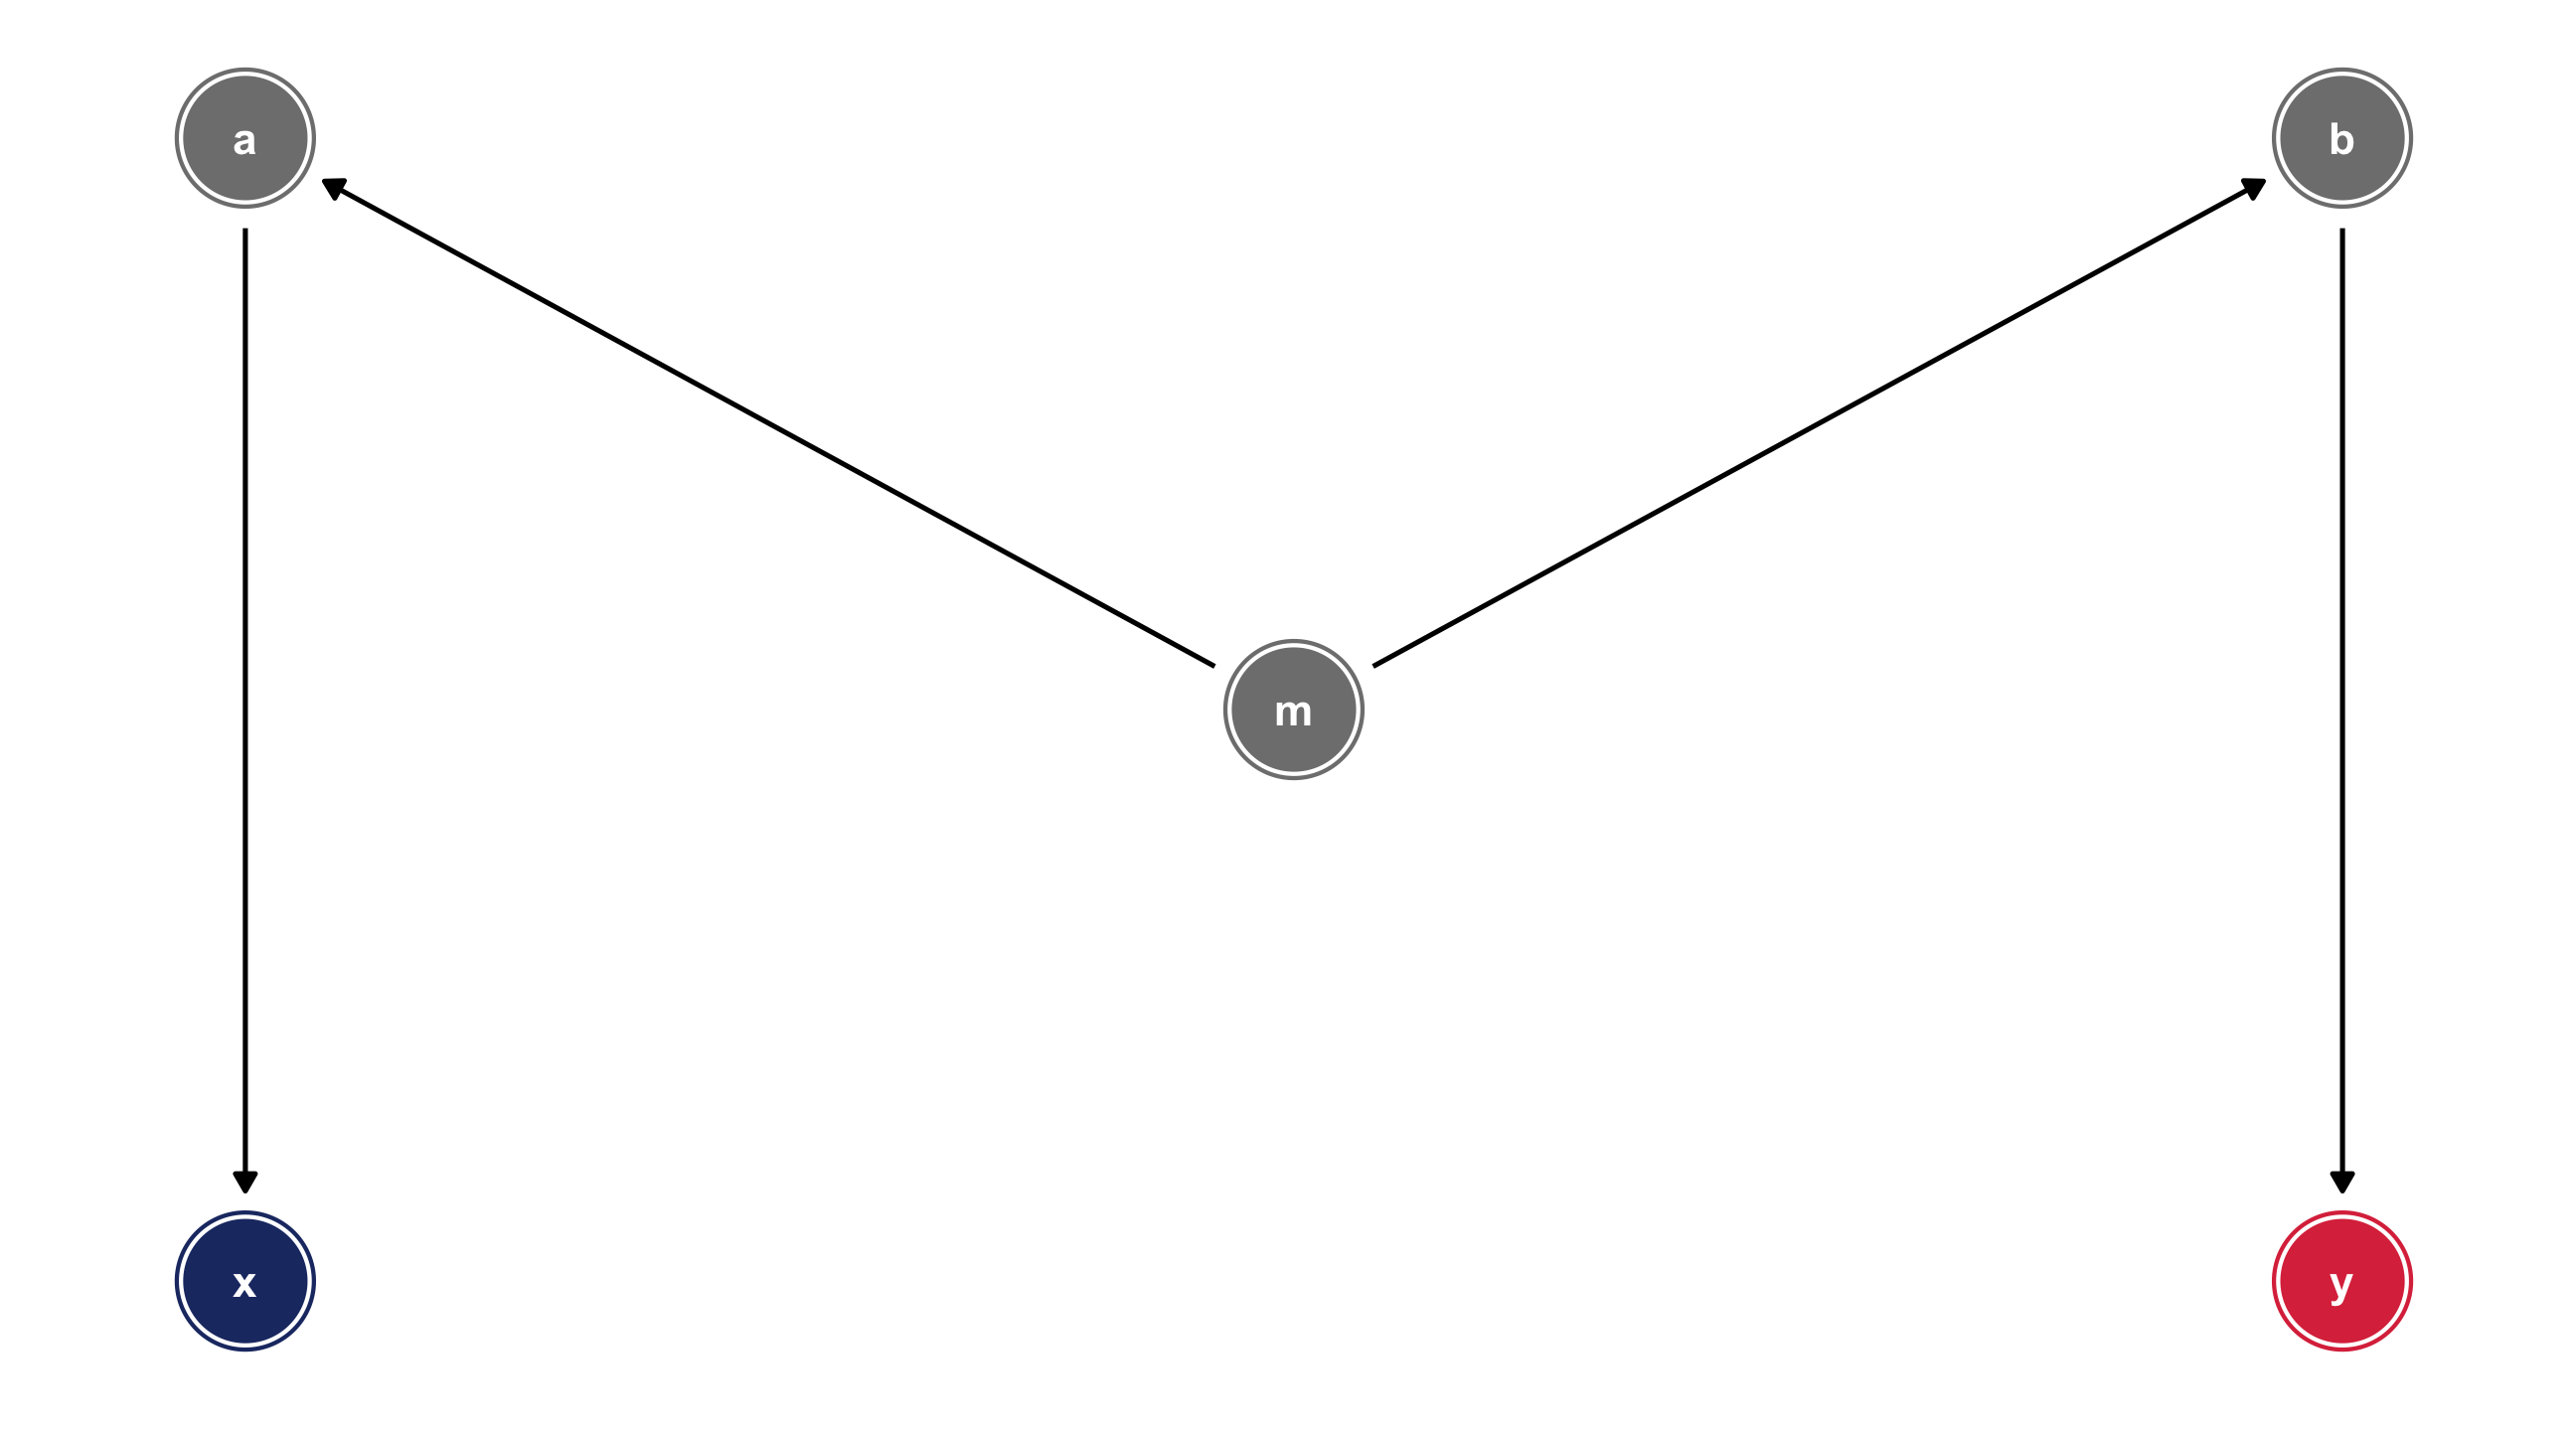
Breaking the path
We can identify X \(\rightarrow\) Y by controlling for any variable in the backdoor path to break the chain: m, a, or b

Solve the DAG
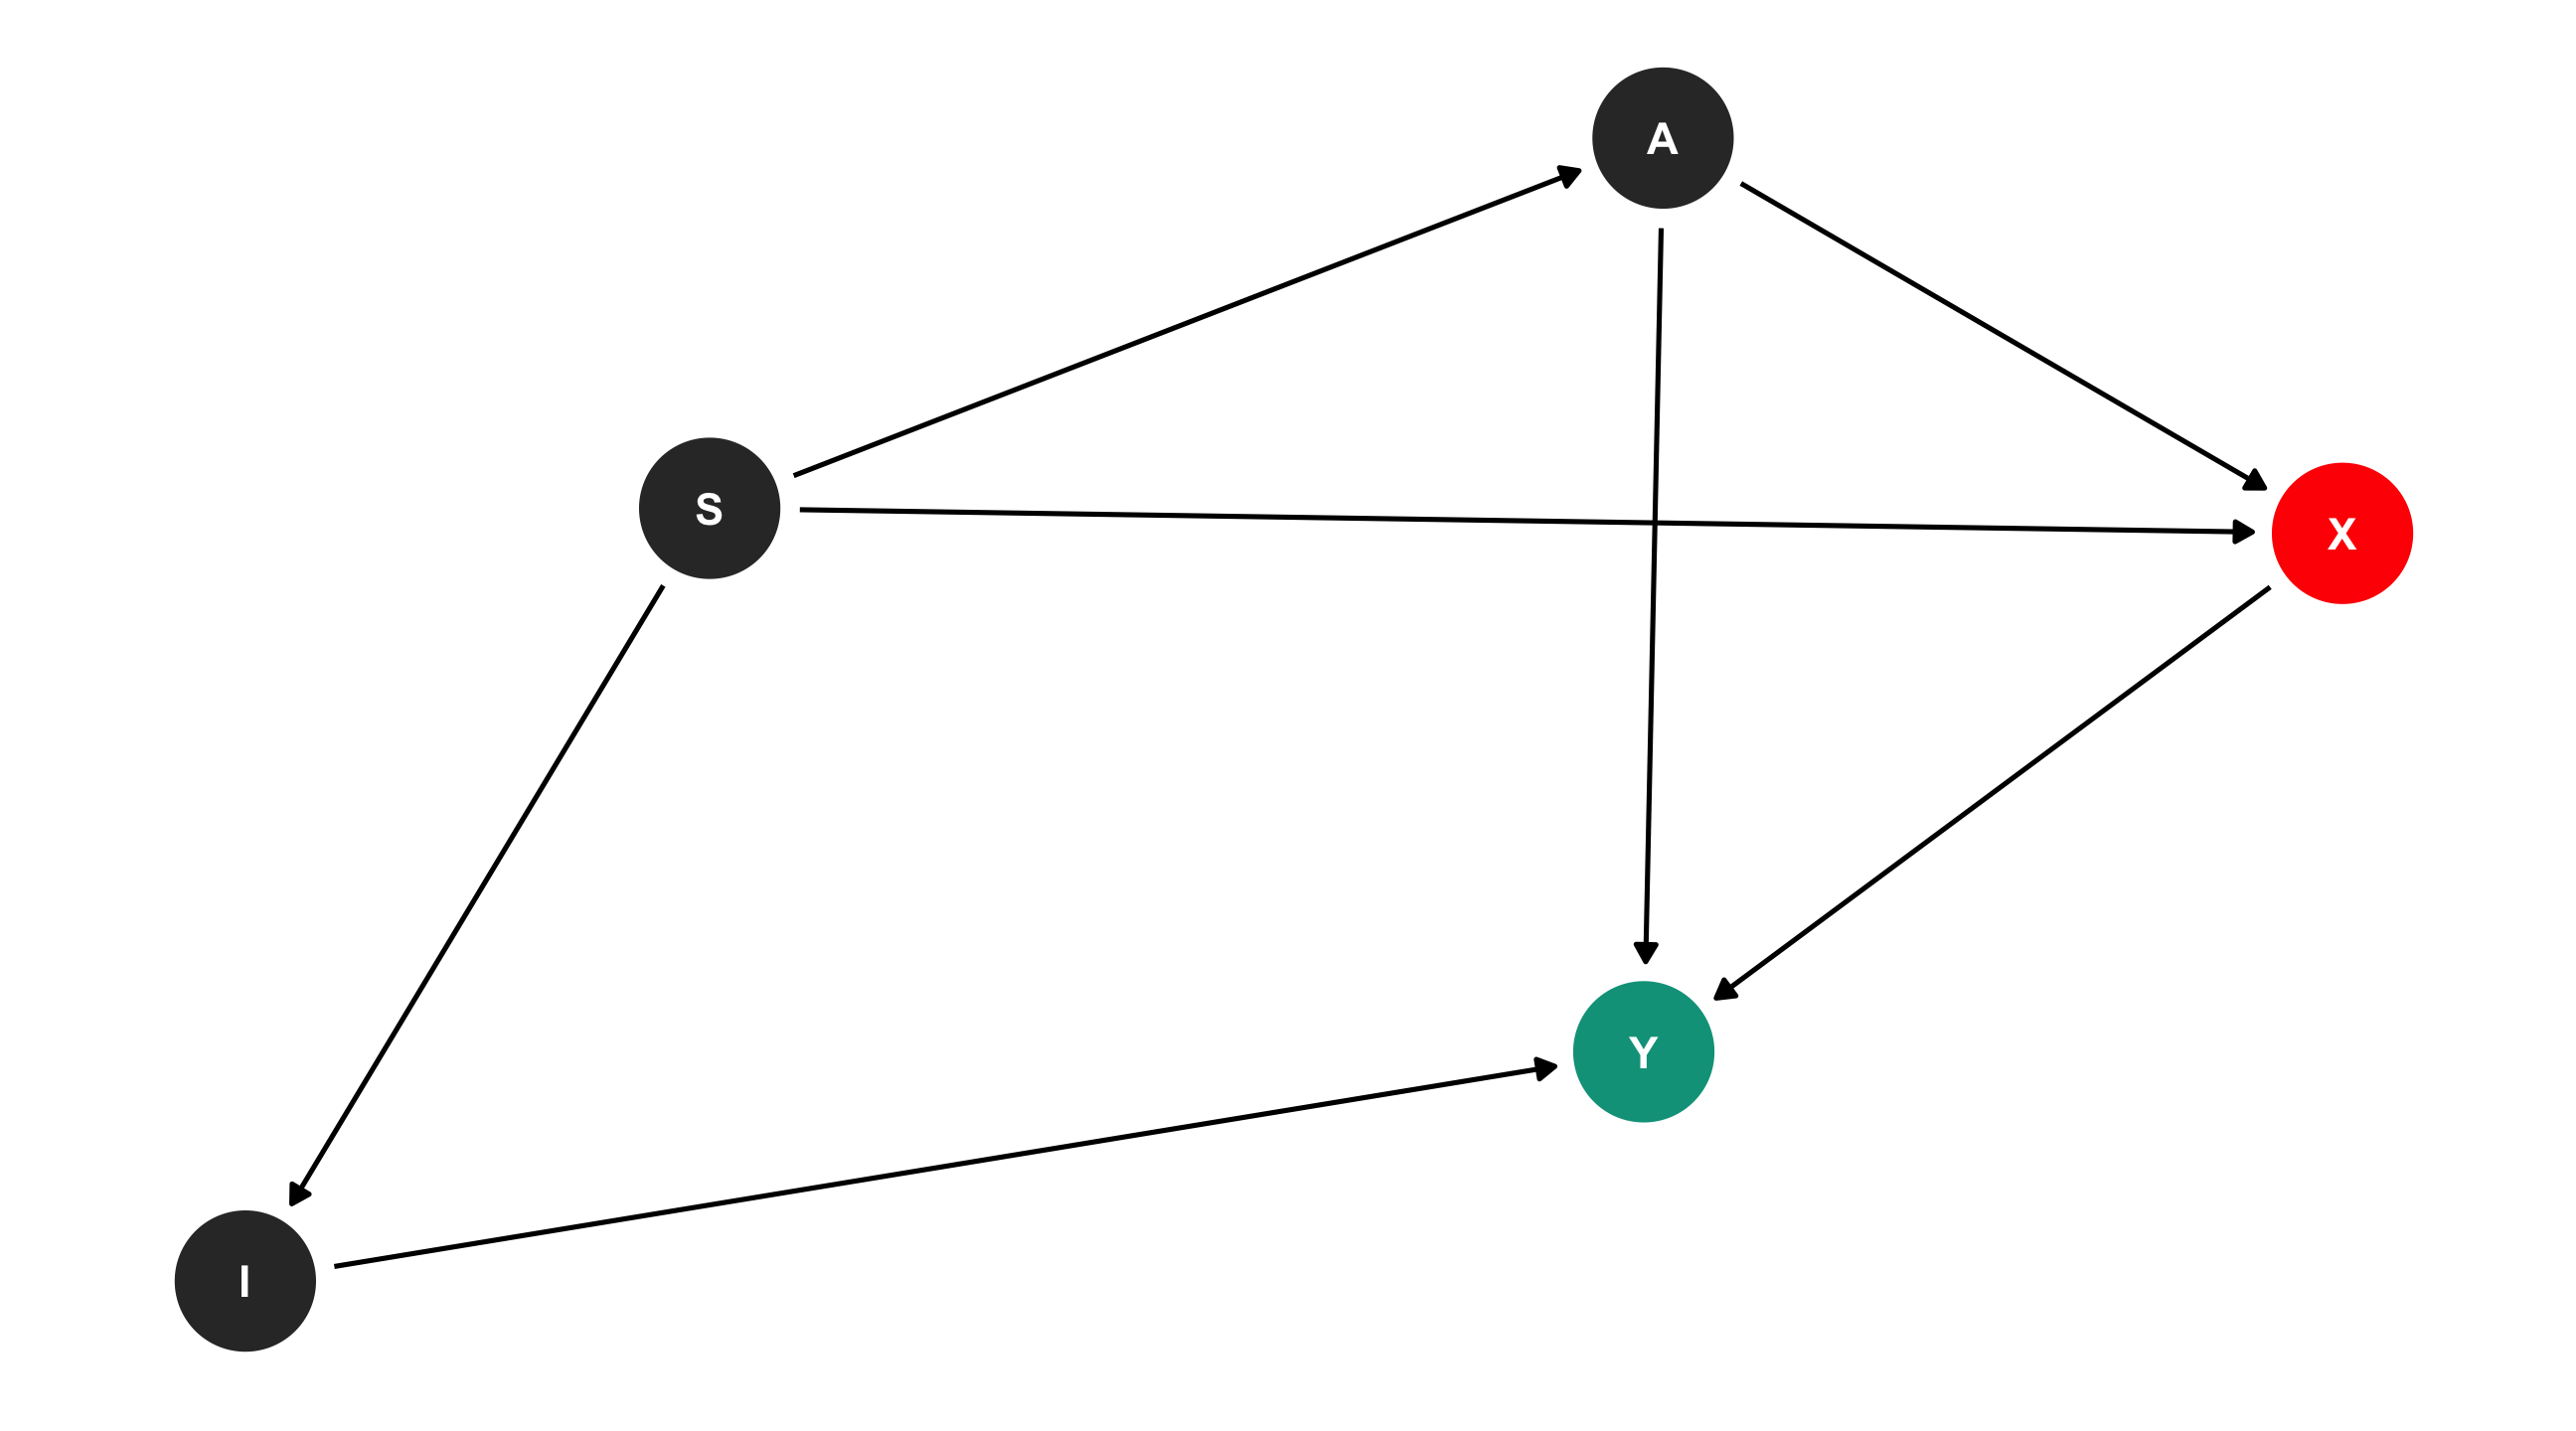
Solve the DAG
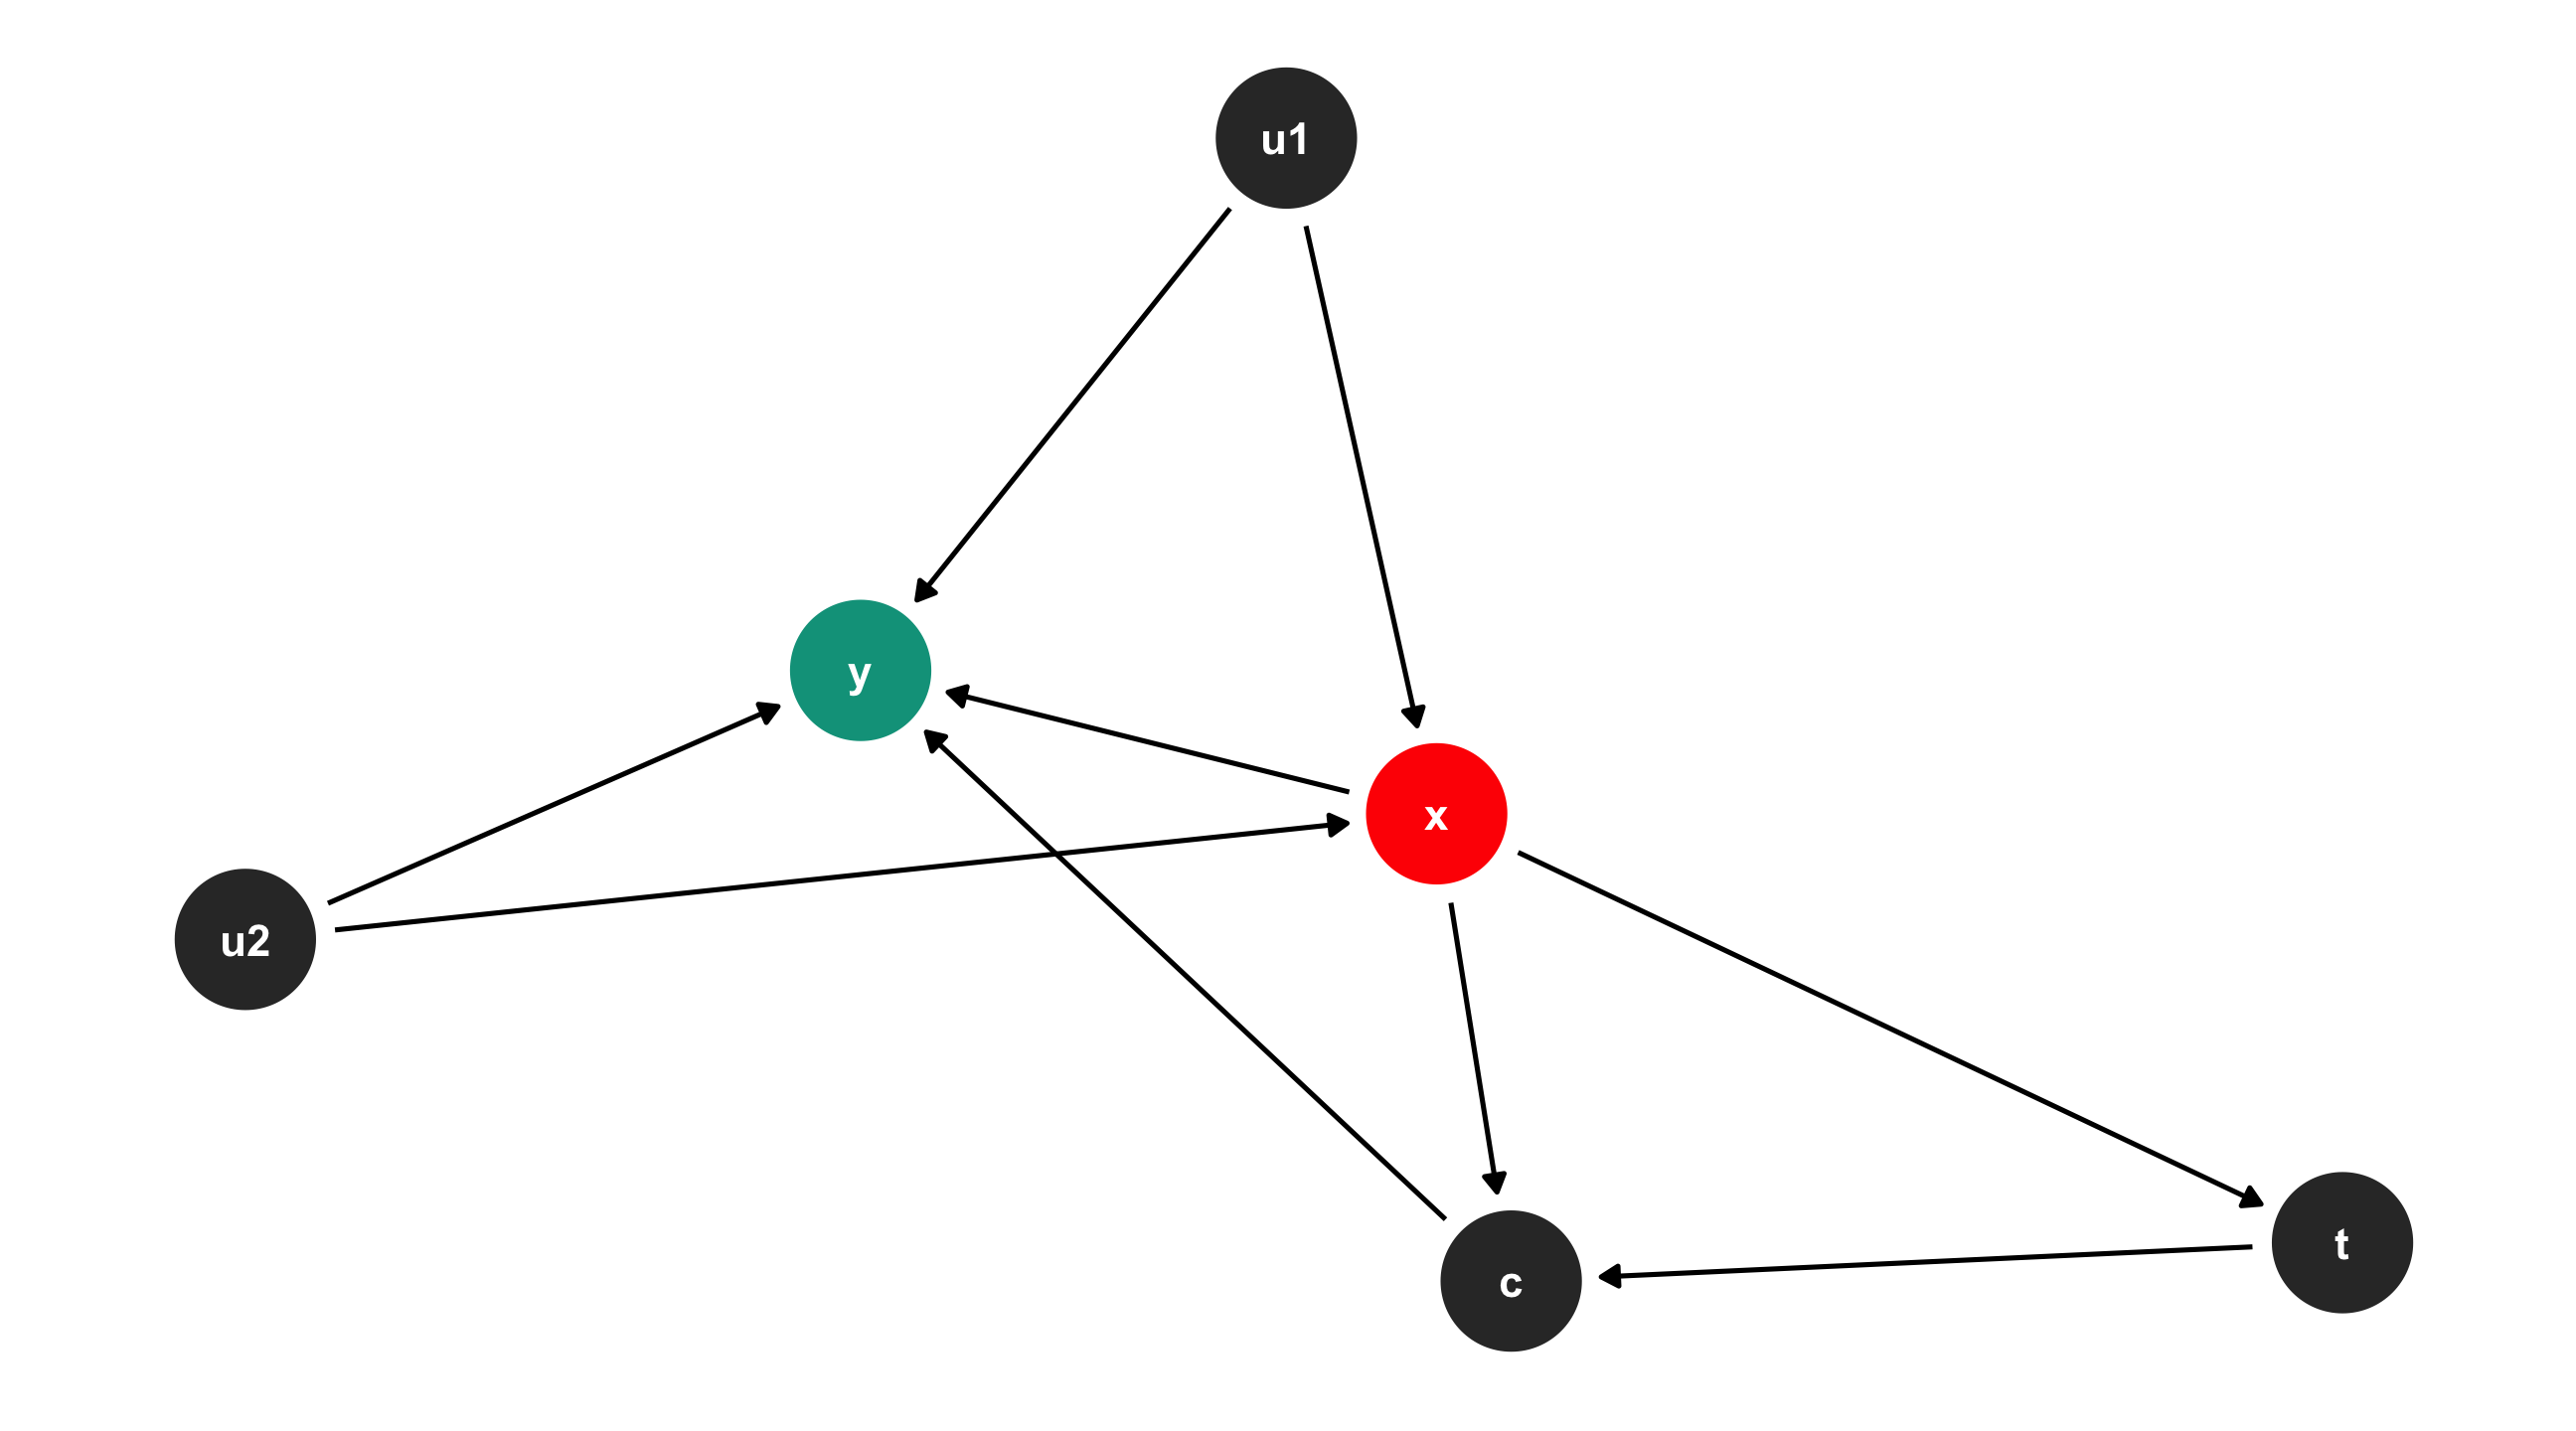
Solve the DAG
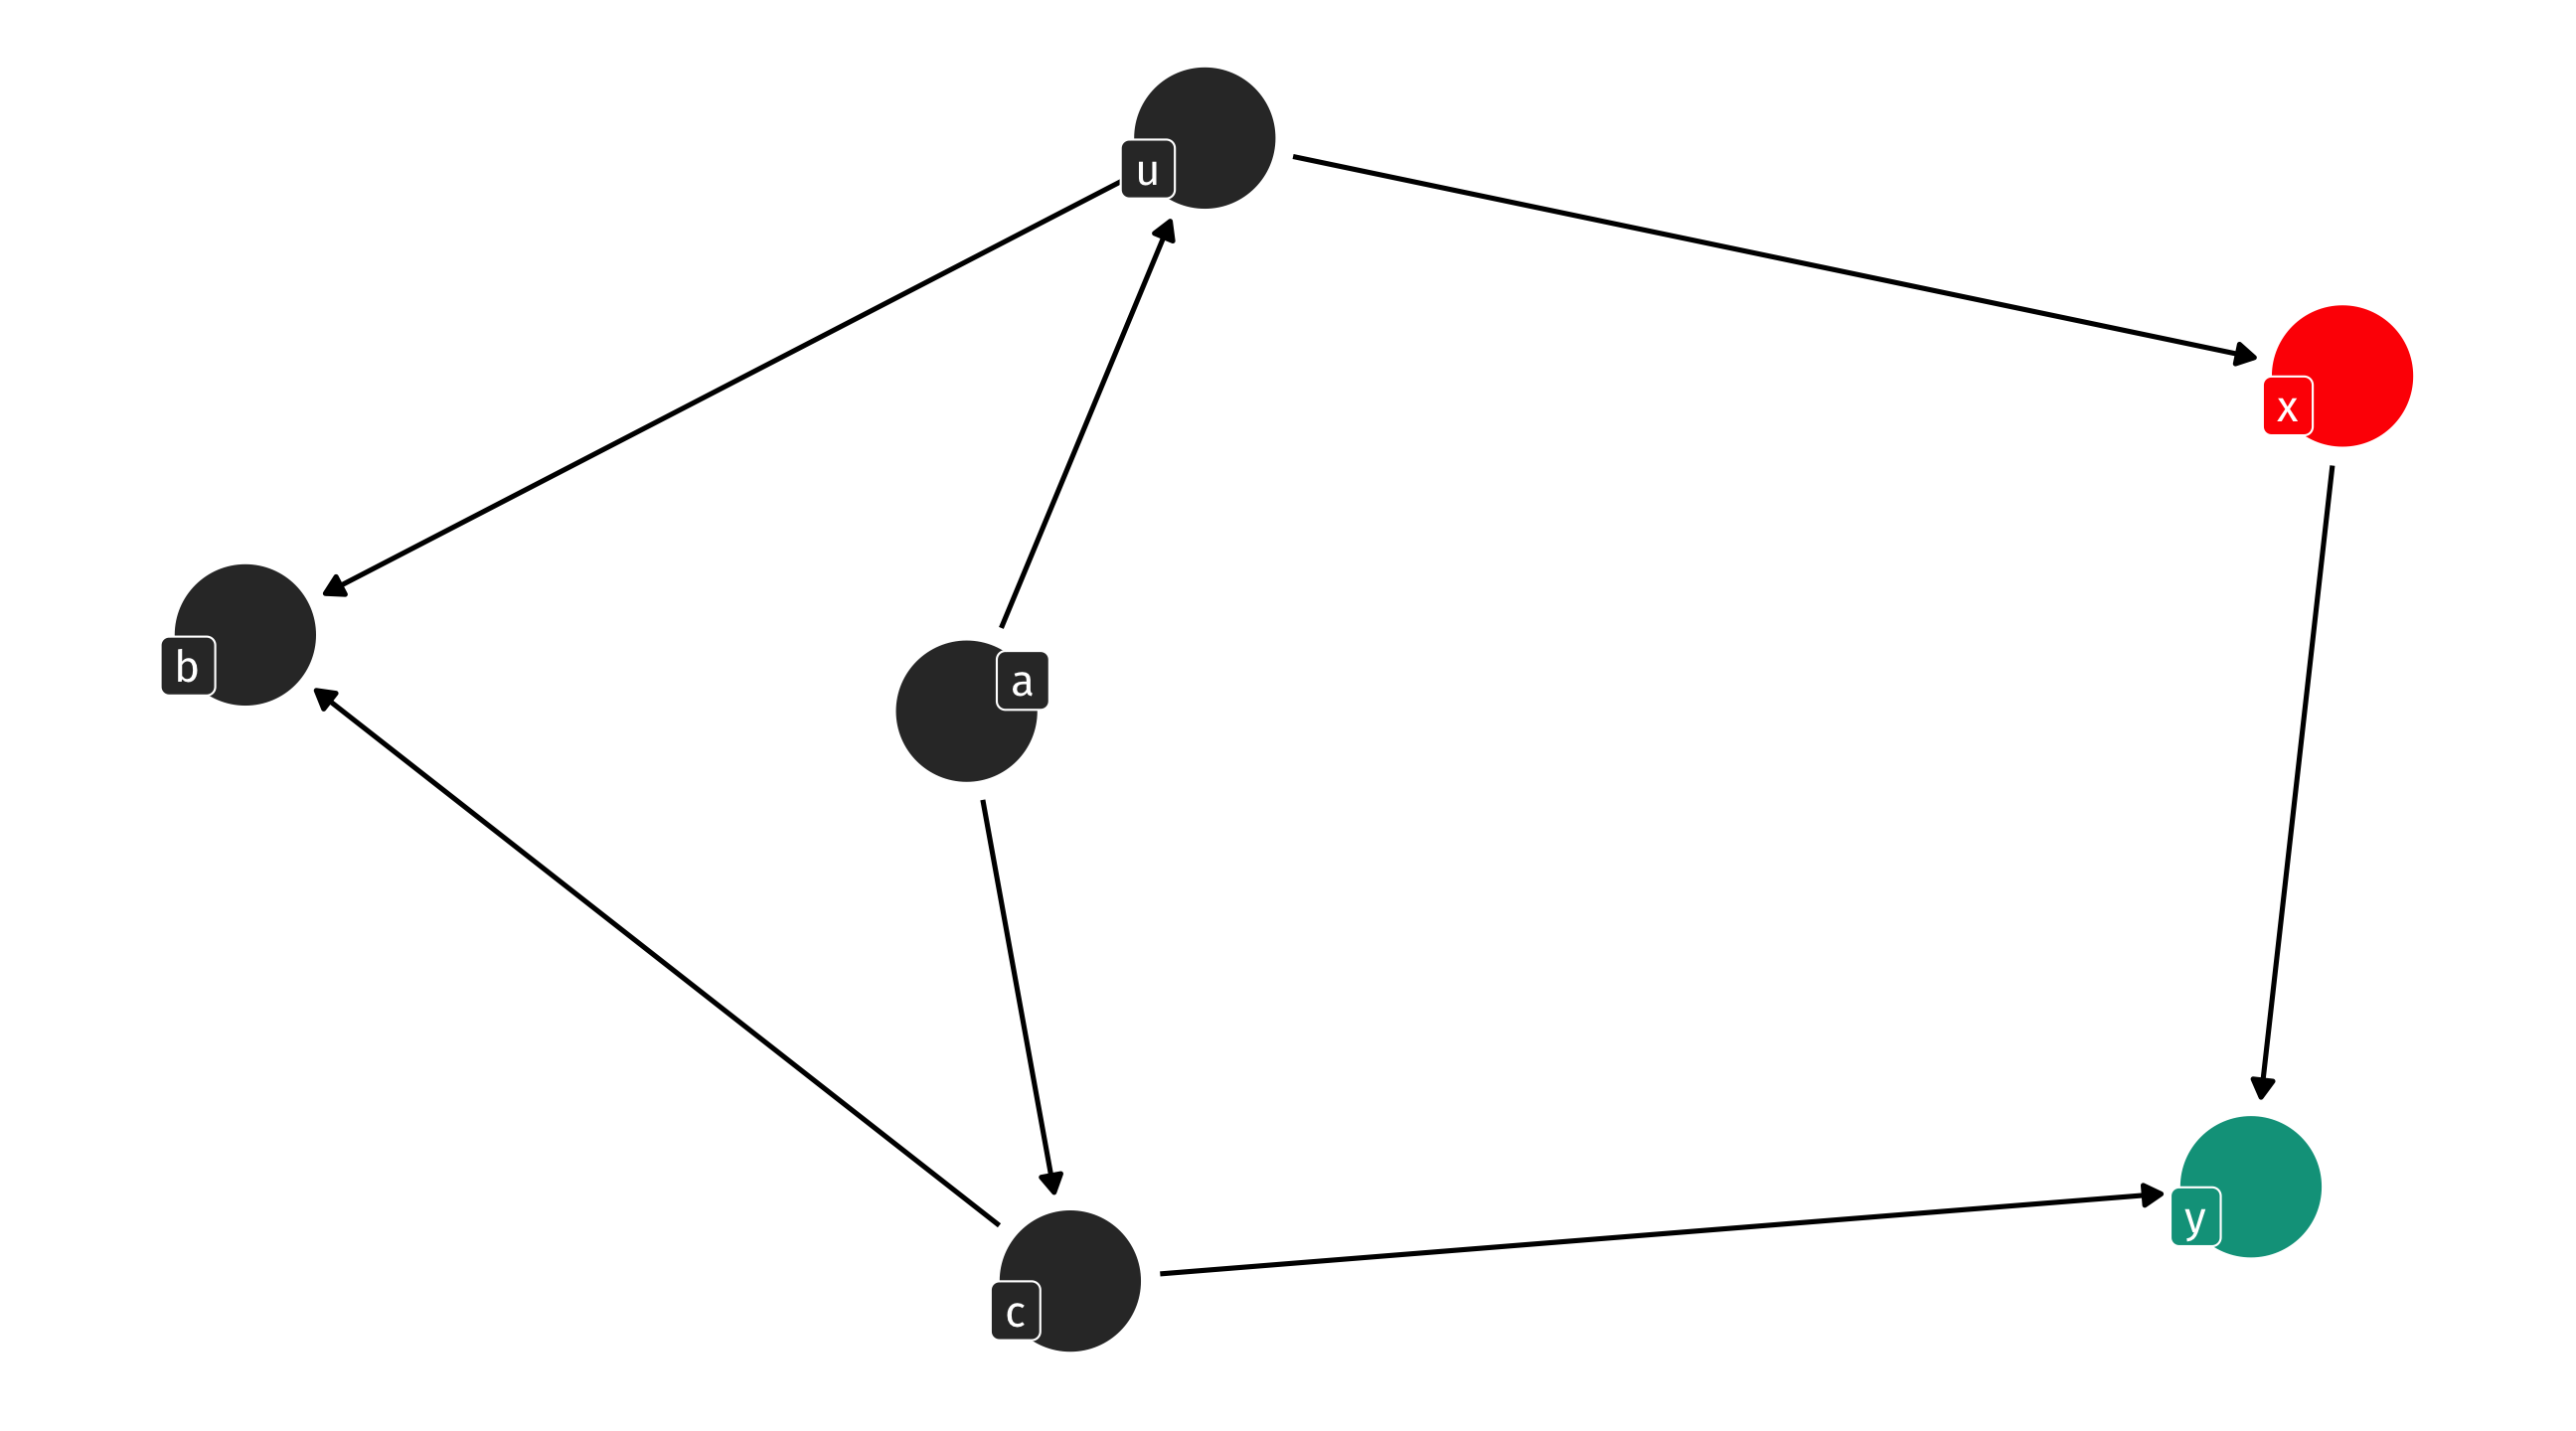
Solve the DAG
Solve the DAG
The makings of a DAG
We can use the dagify() function, from ggdag, to make a DAG
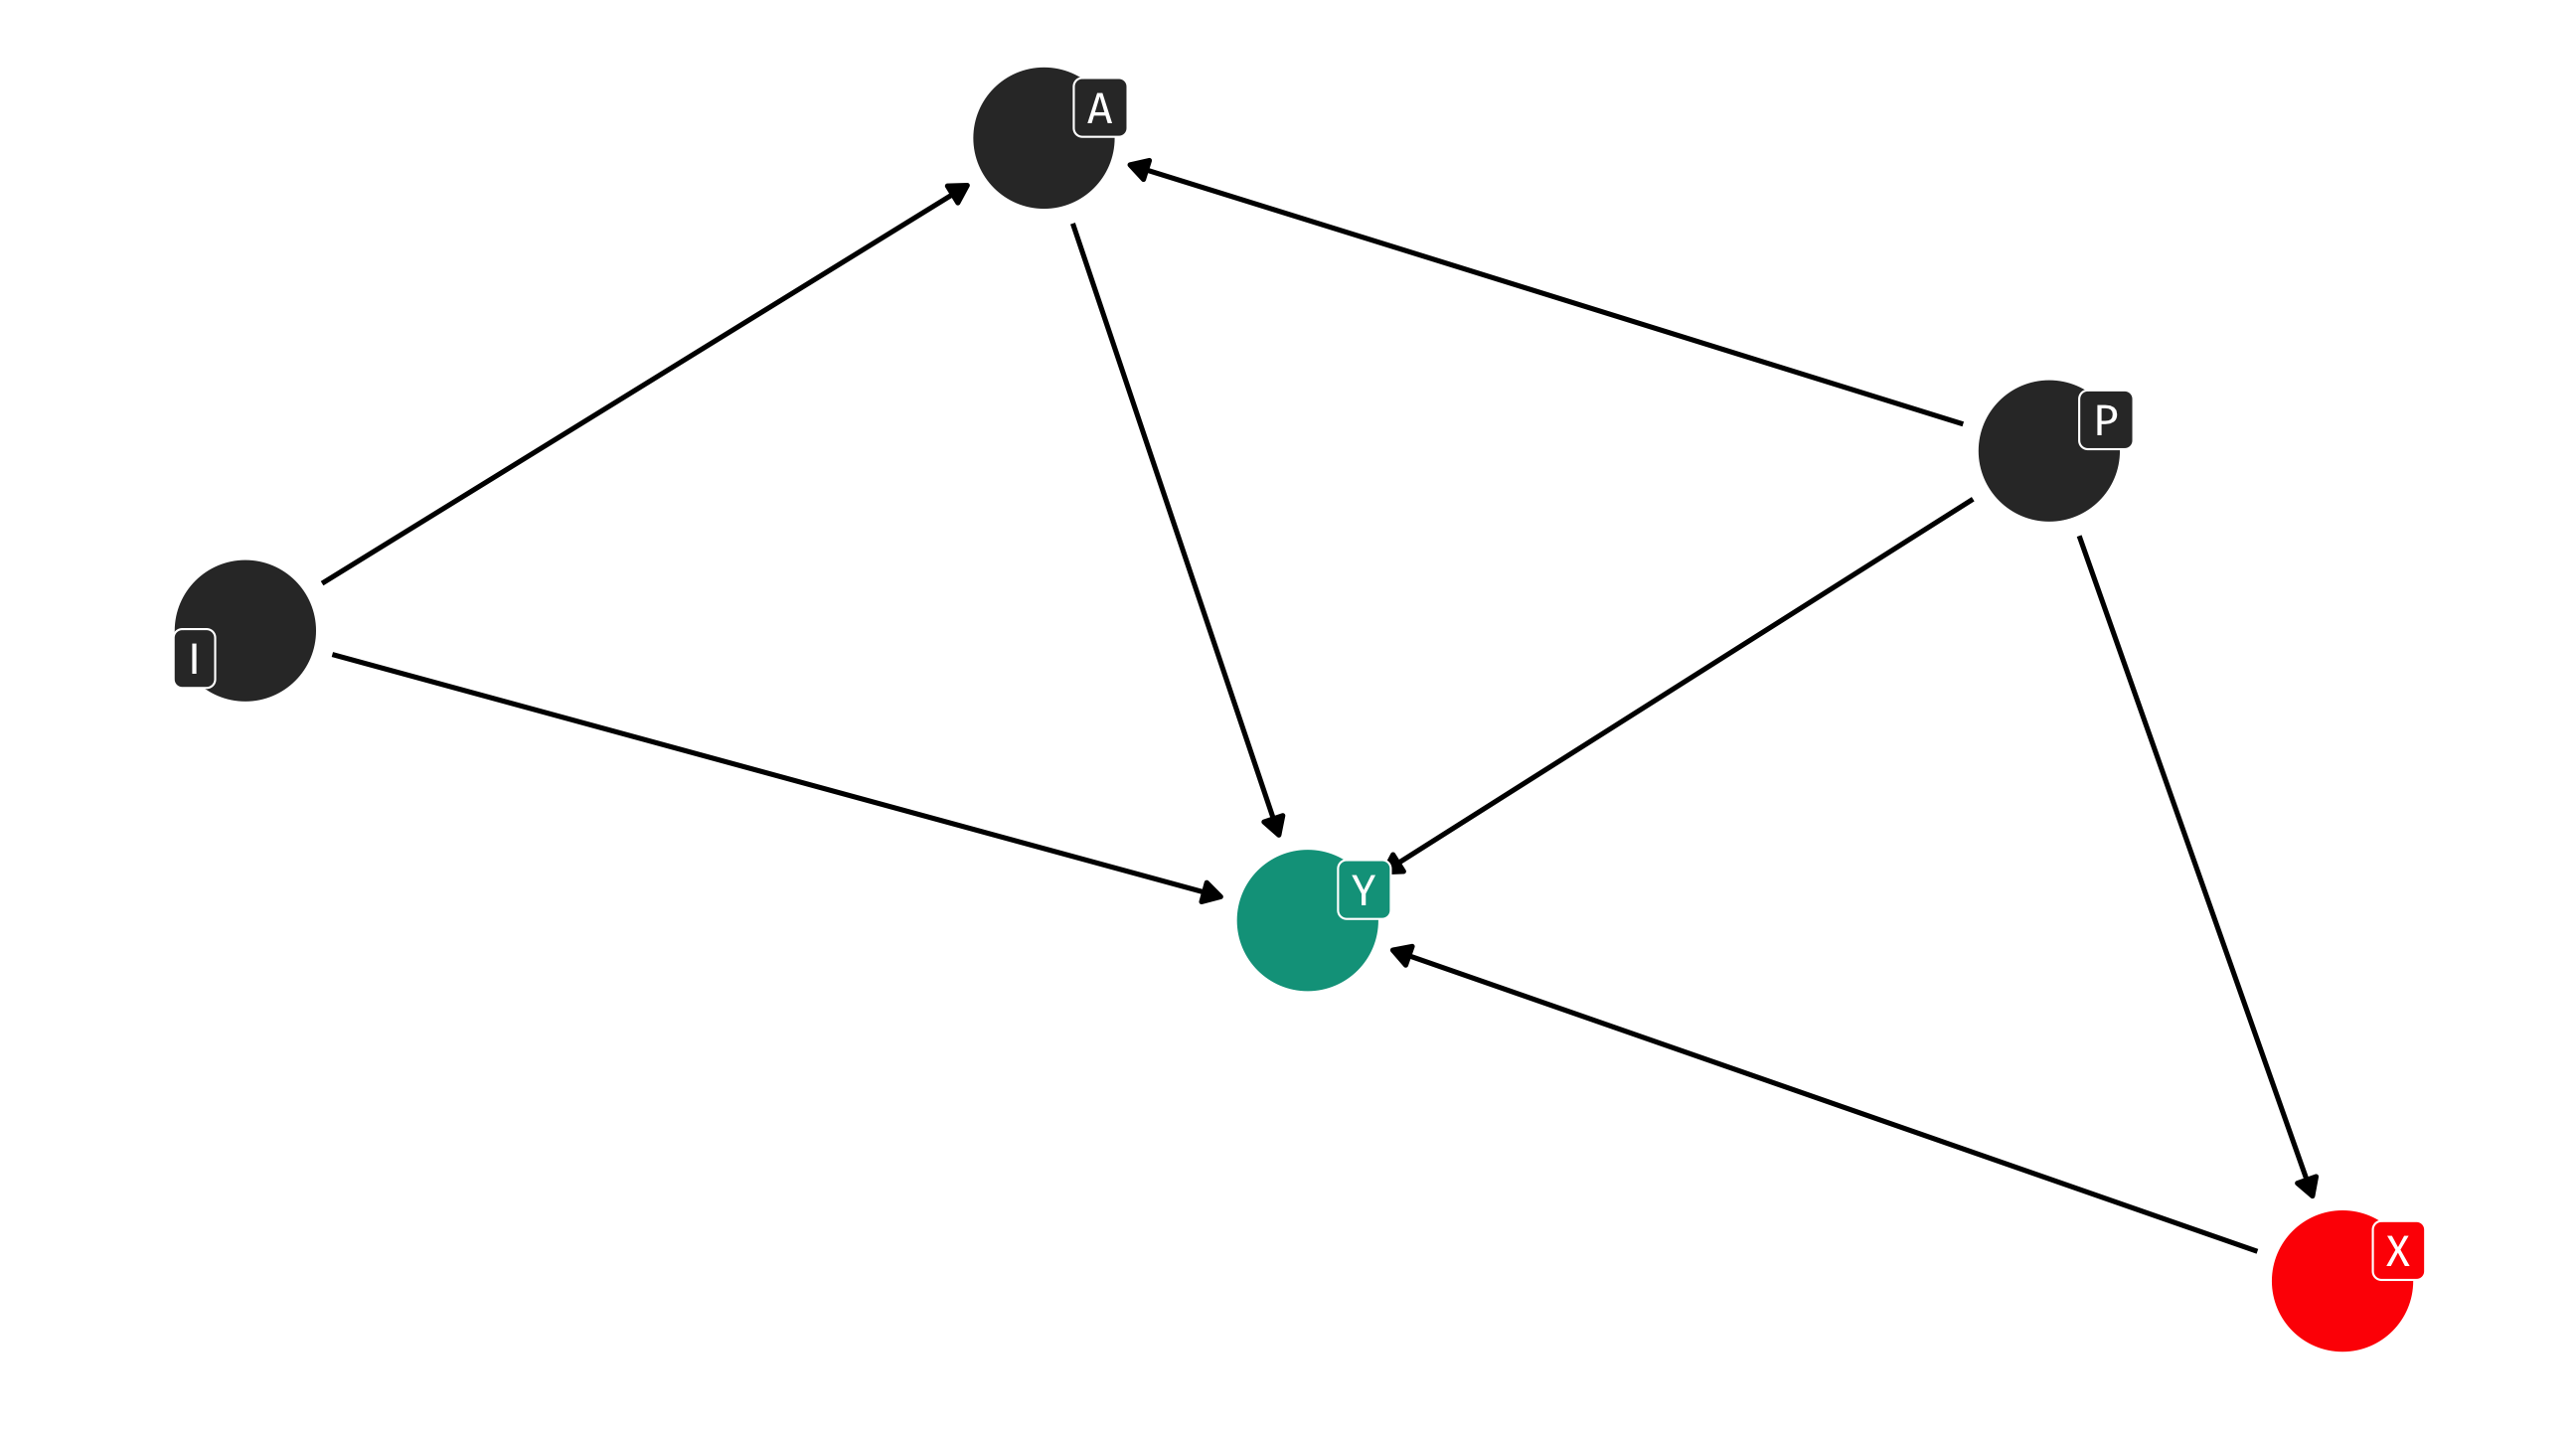
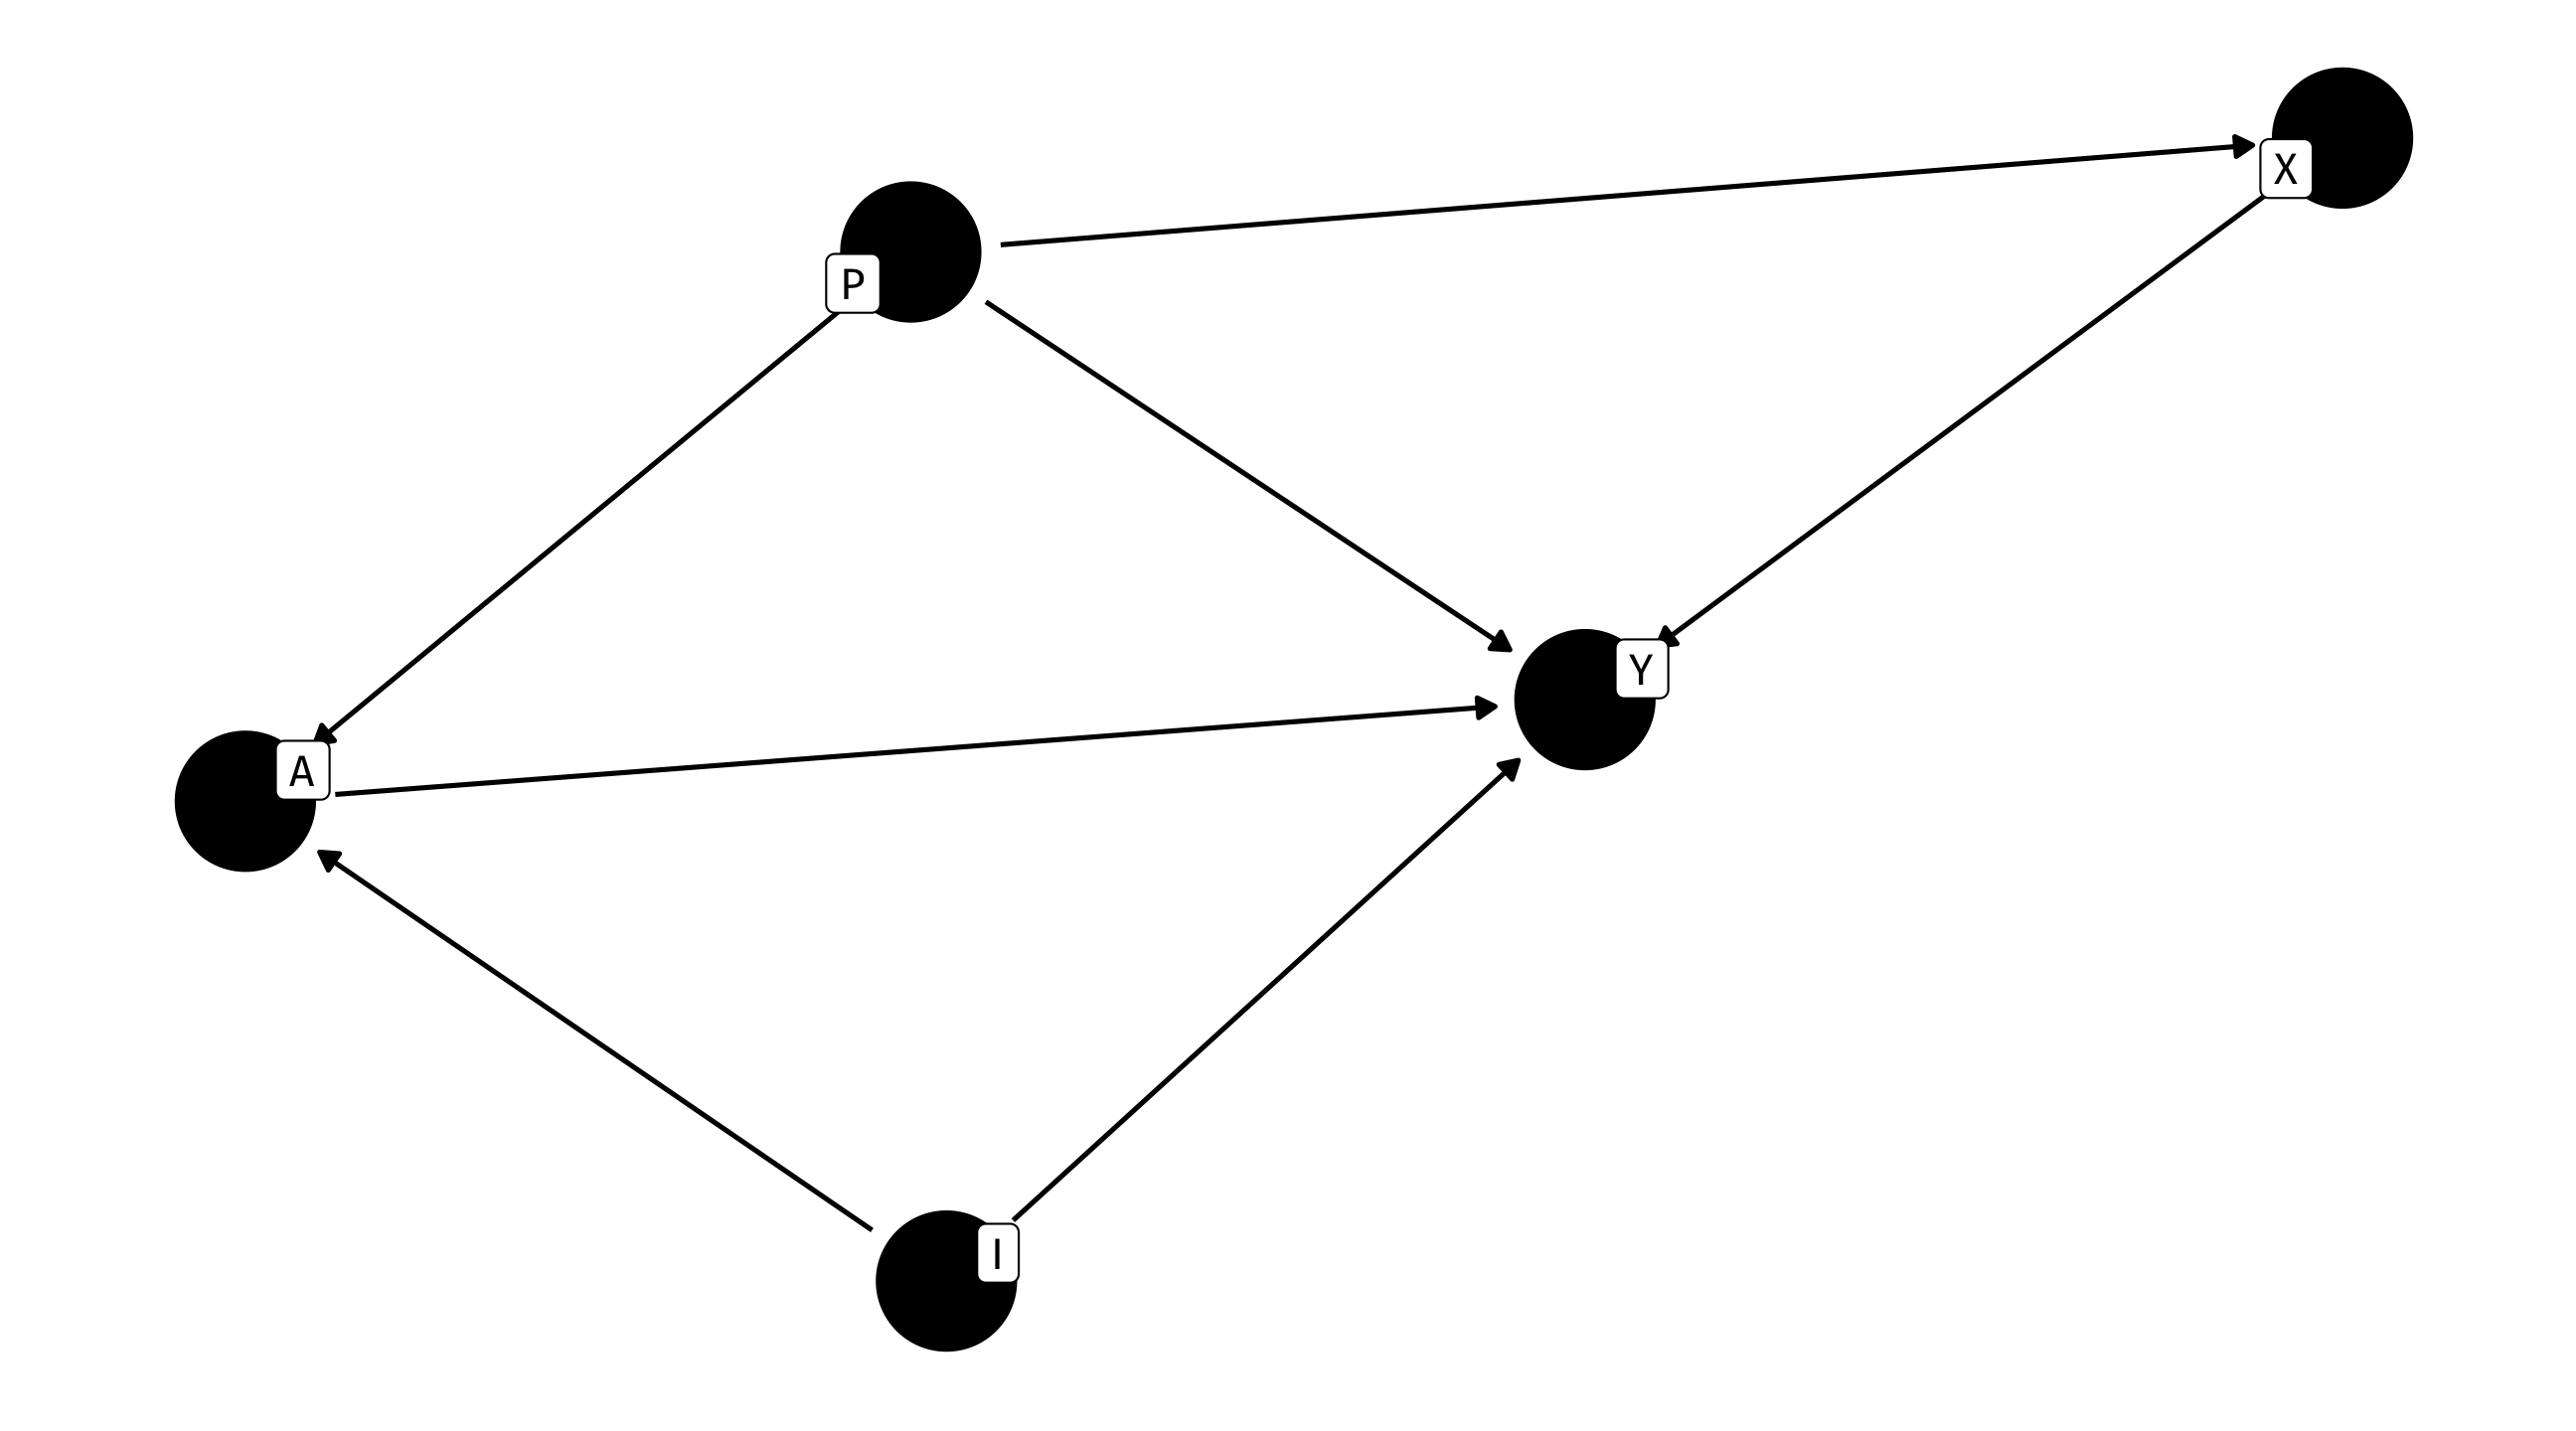
Plotting with ggdag
We can plot our DAG object using ggdag
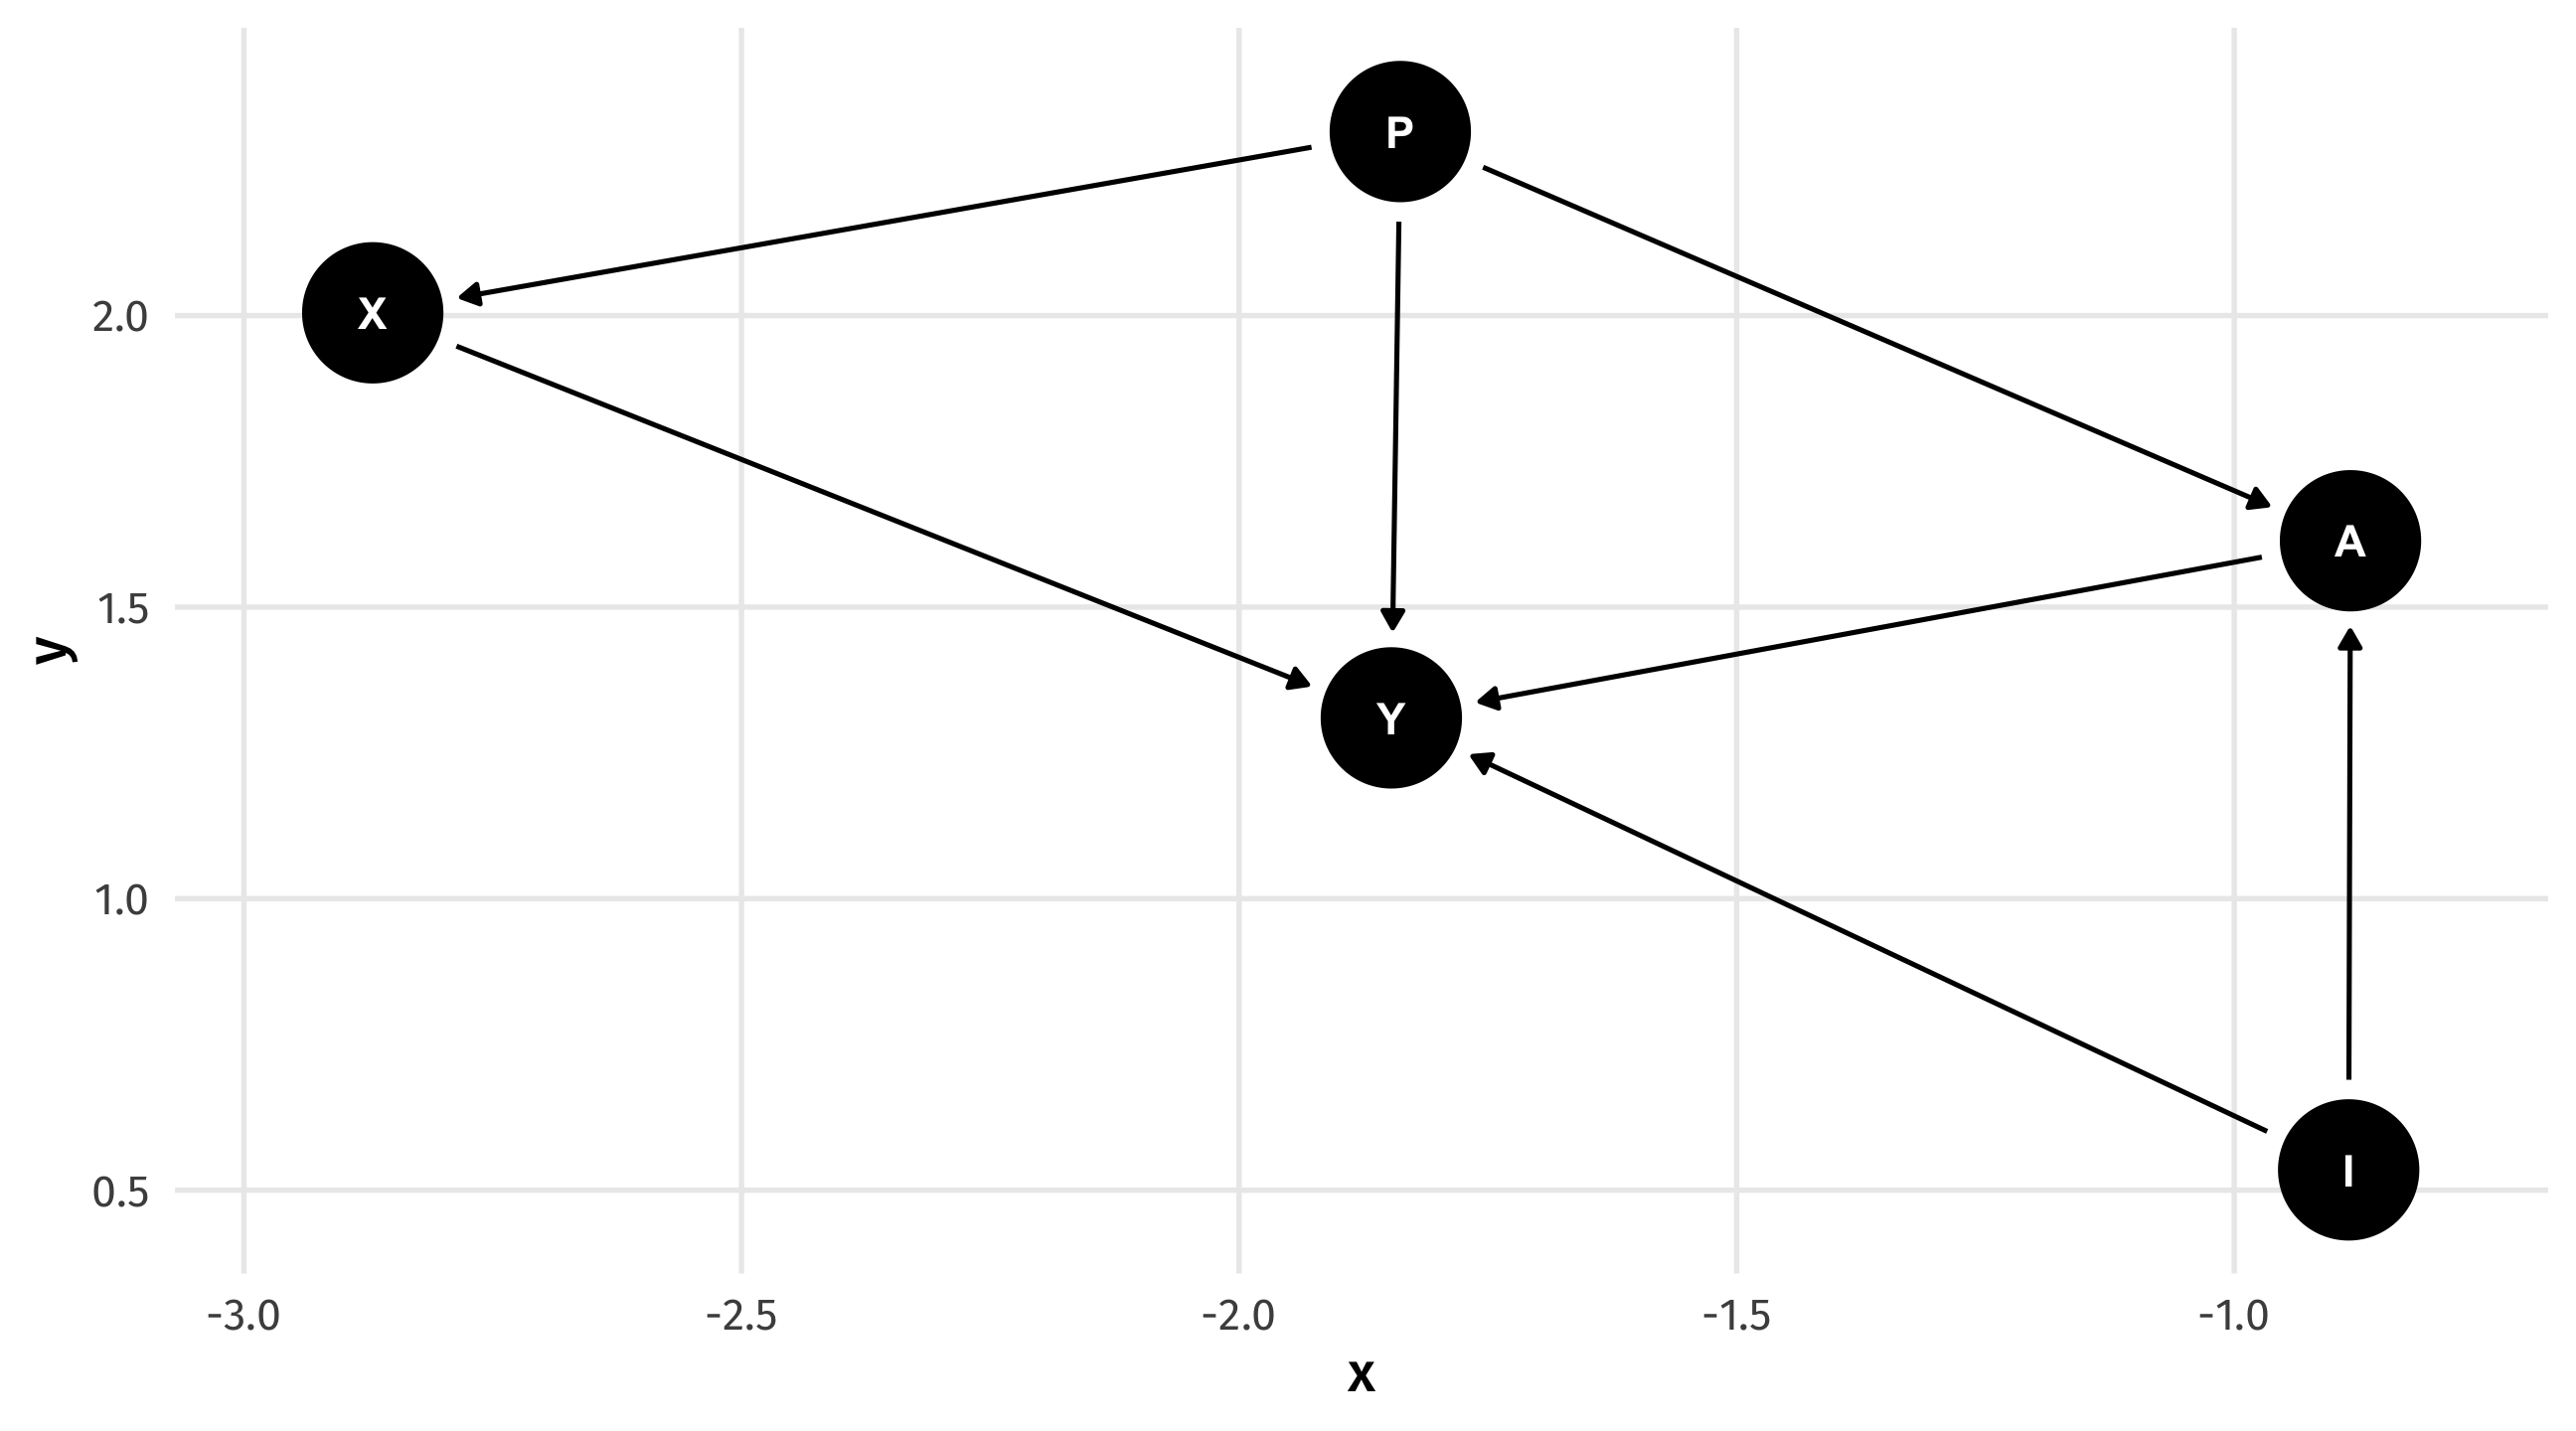
Note
The plots produced by ggdag will vary randomly
Seeing the paths
We can see all the paths from X to Y using ggdag_paths():
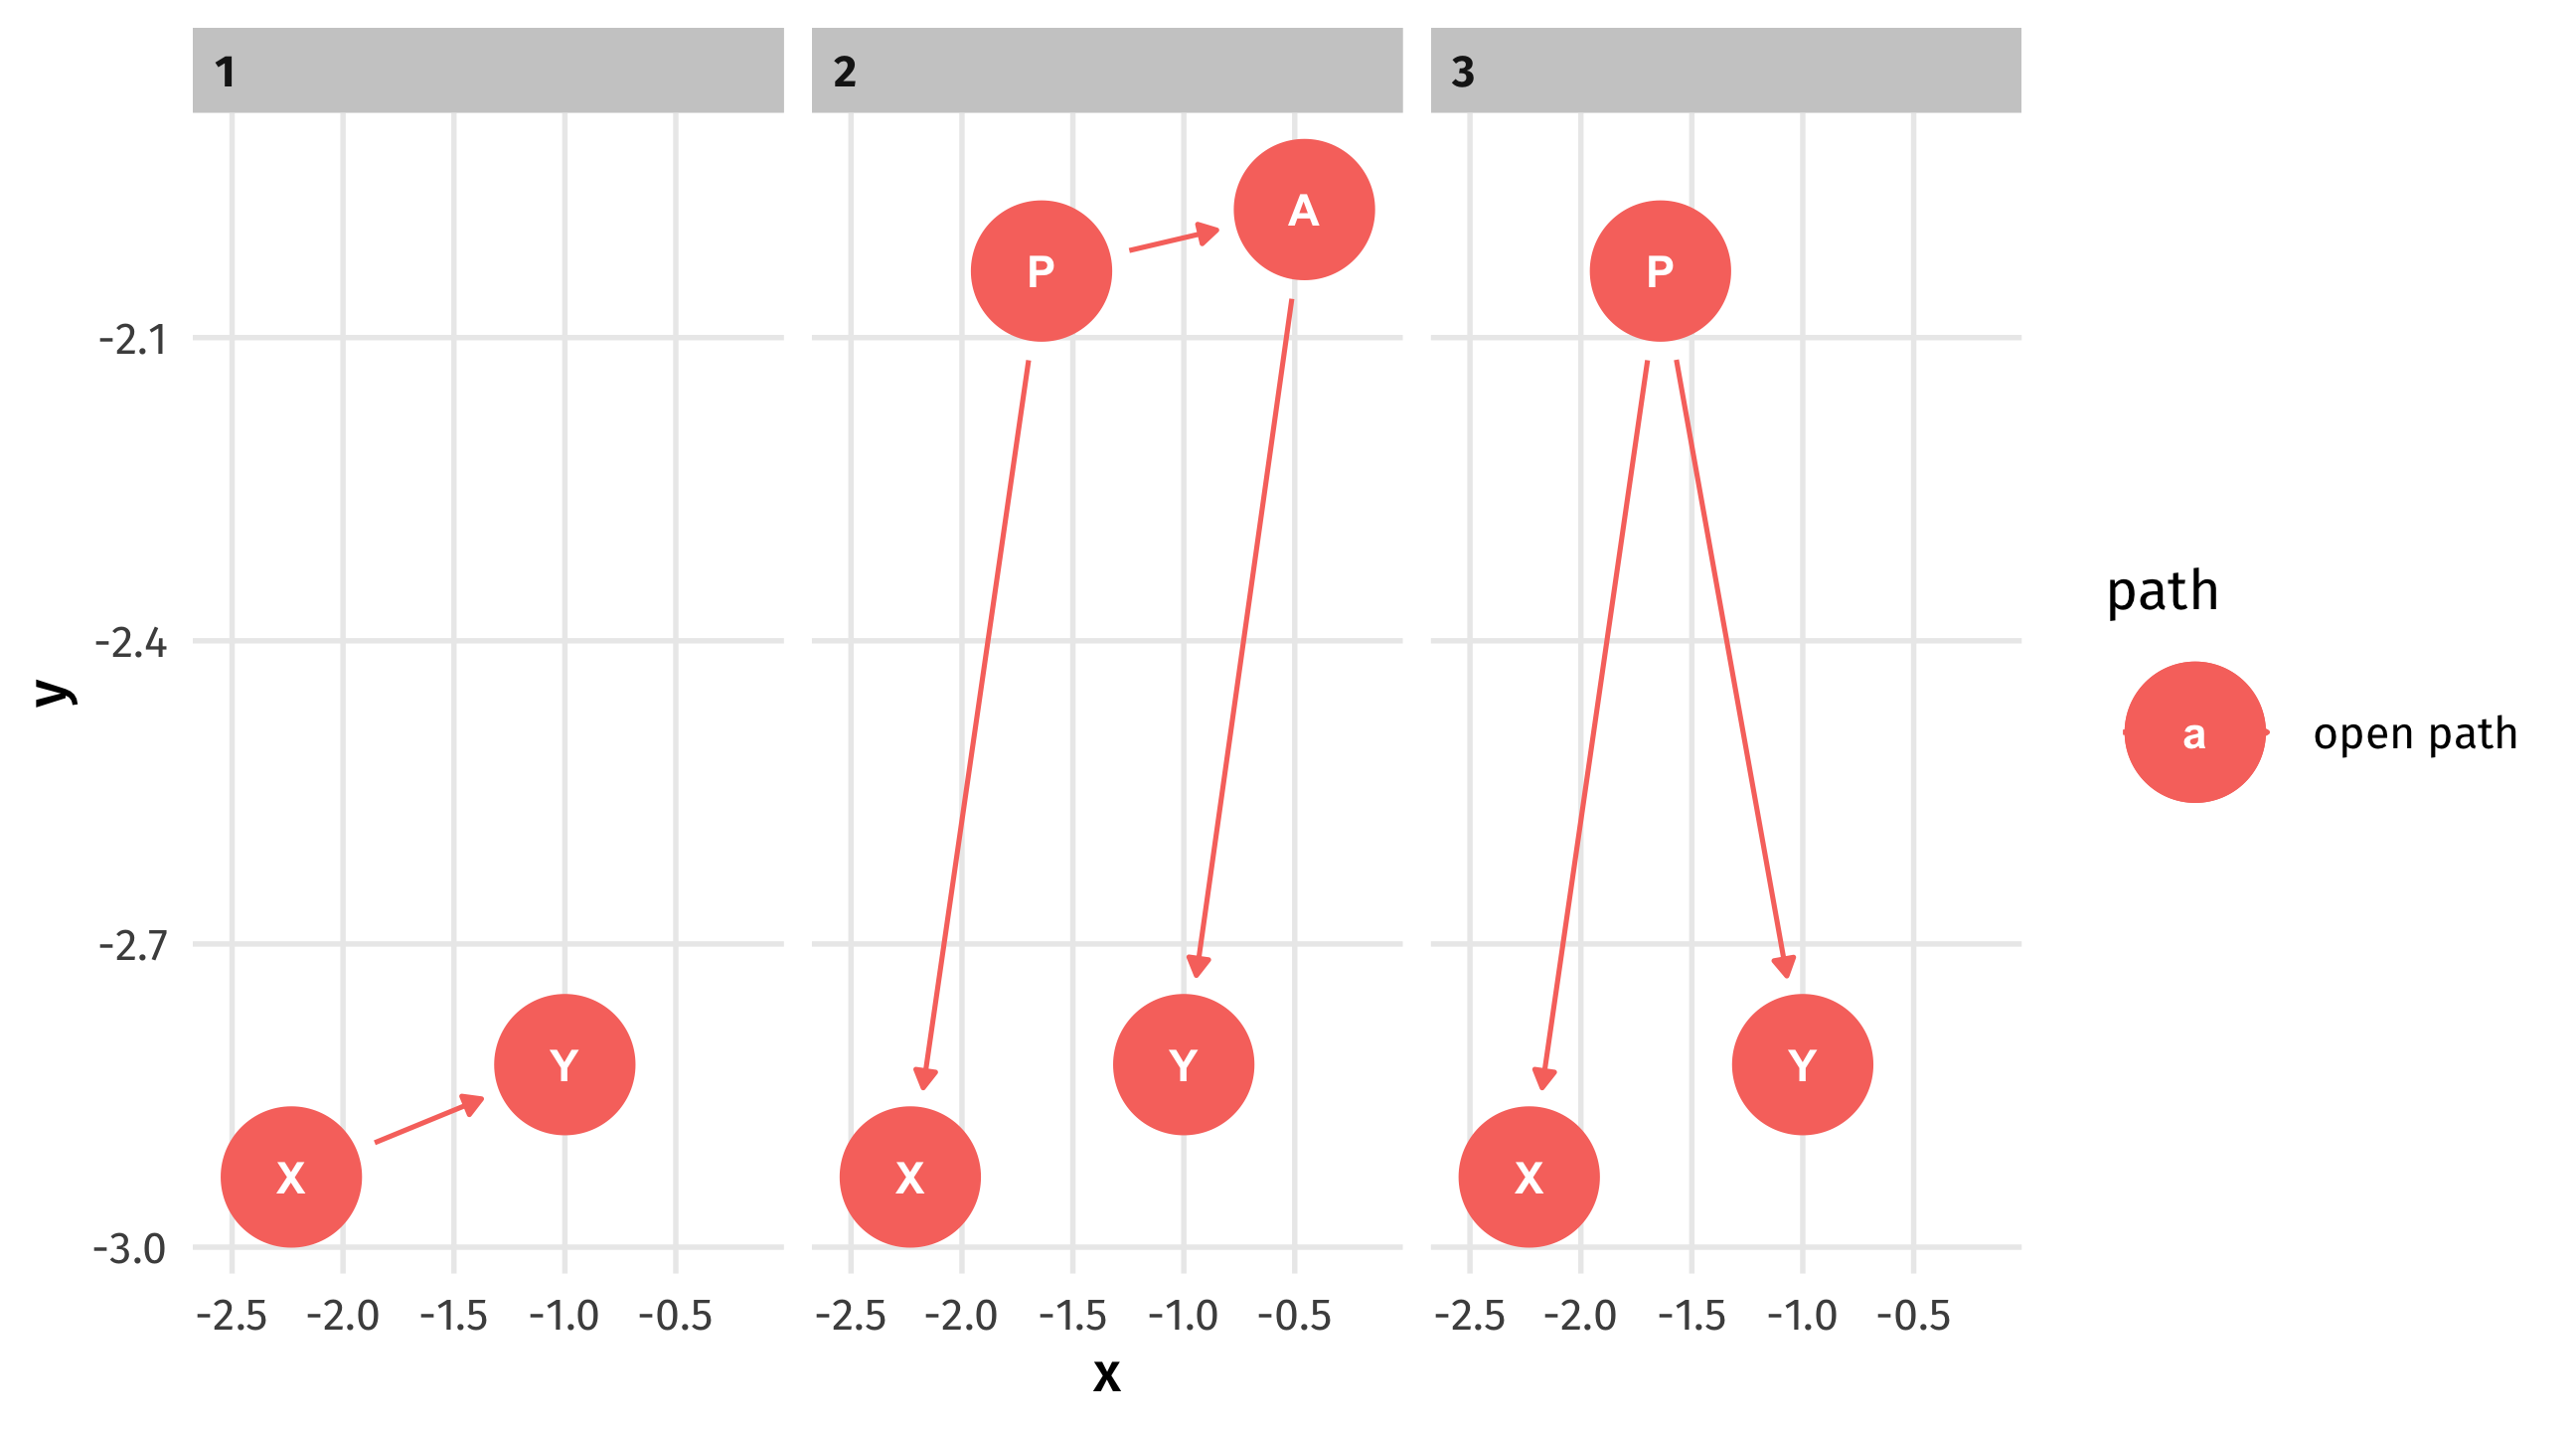
Note
1 is a front-door path, 2 and 3 are backdoor
What to control for?
We identify what to control for using ggdag_adjustment_set (in this case P):
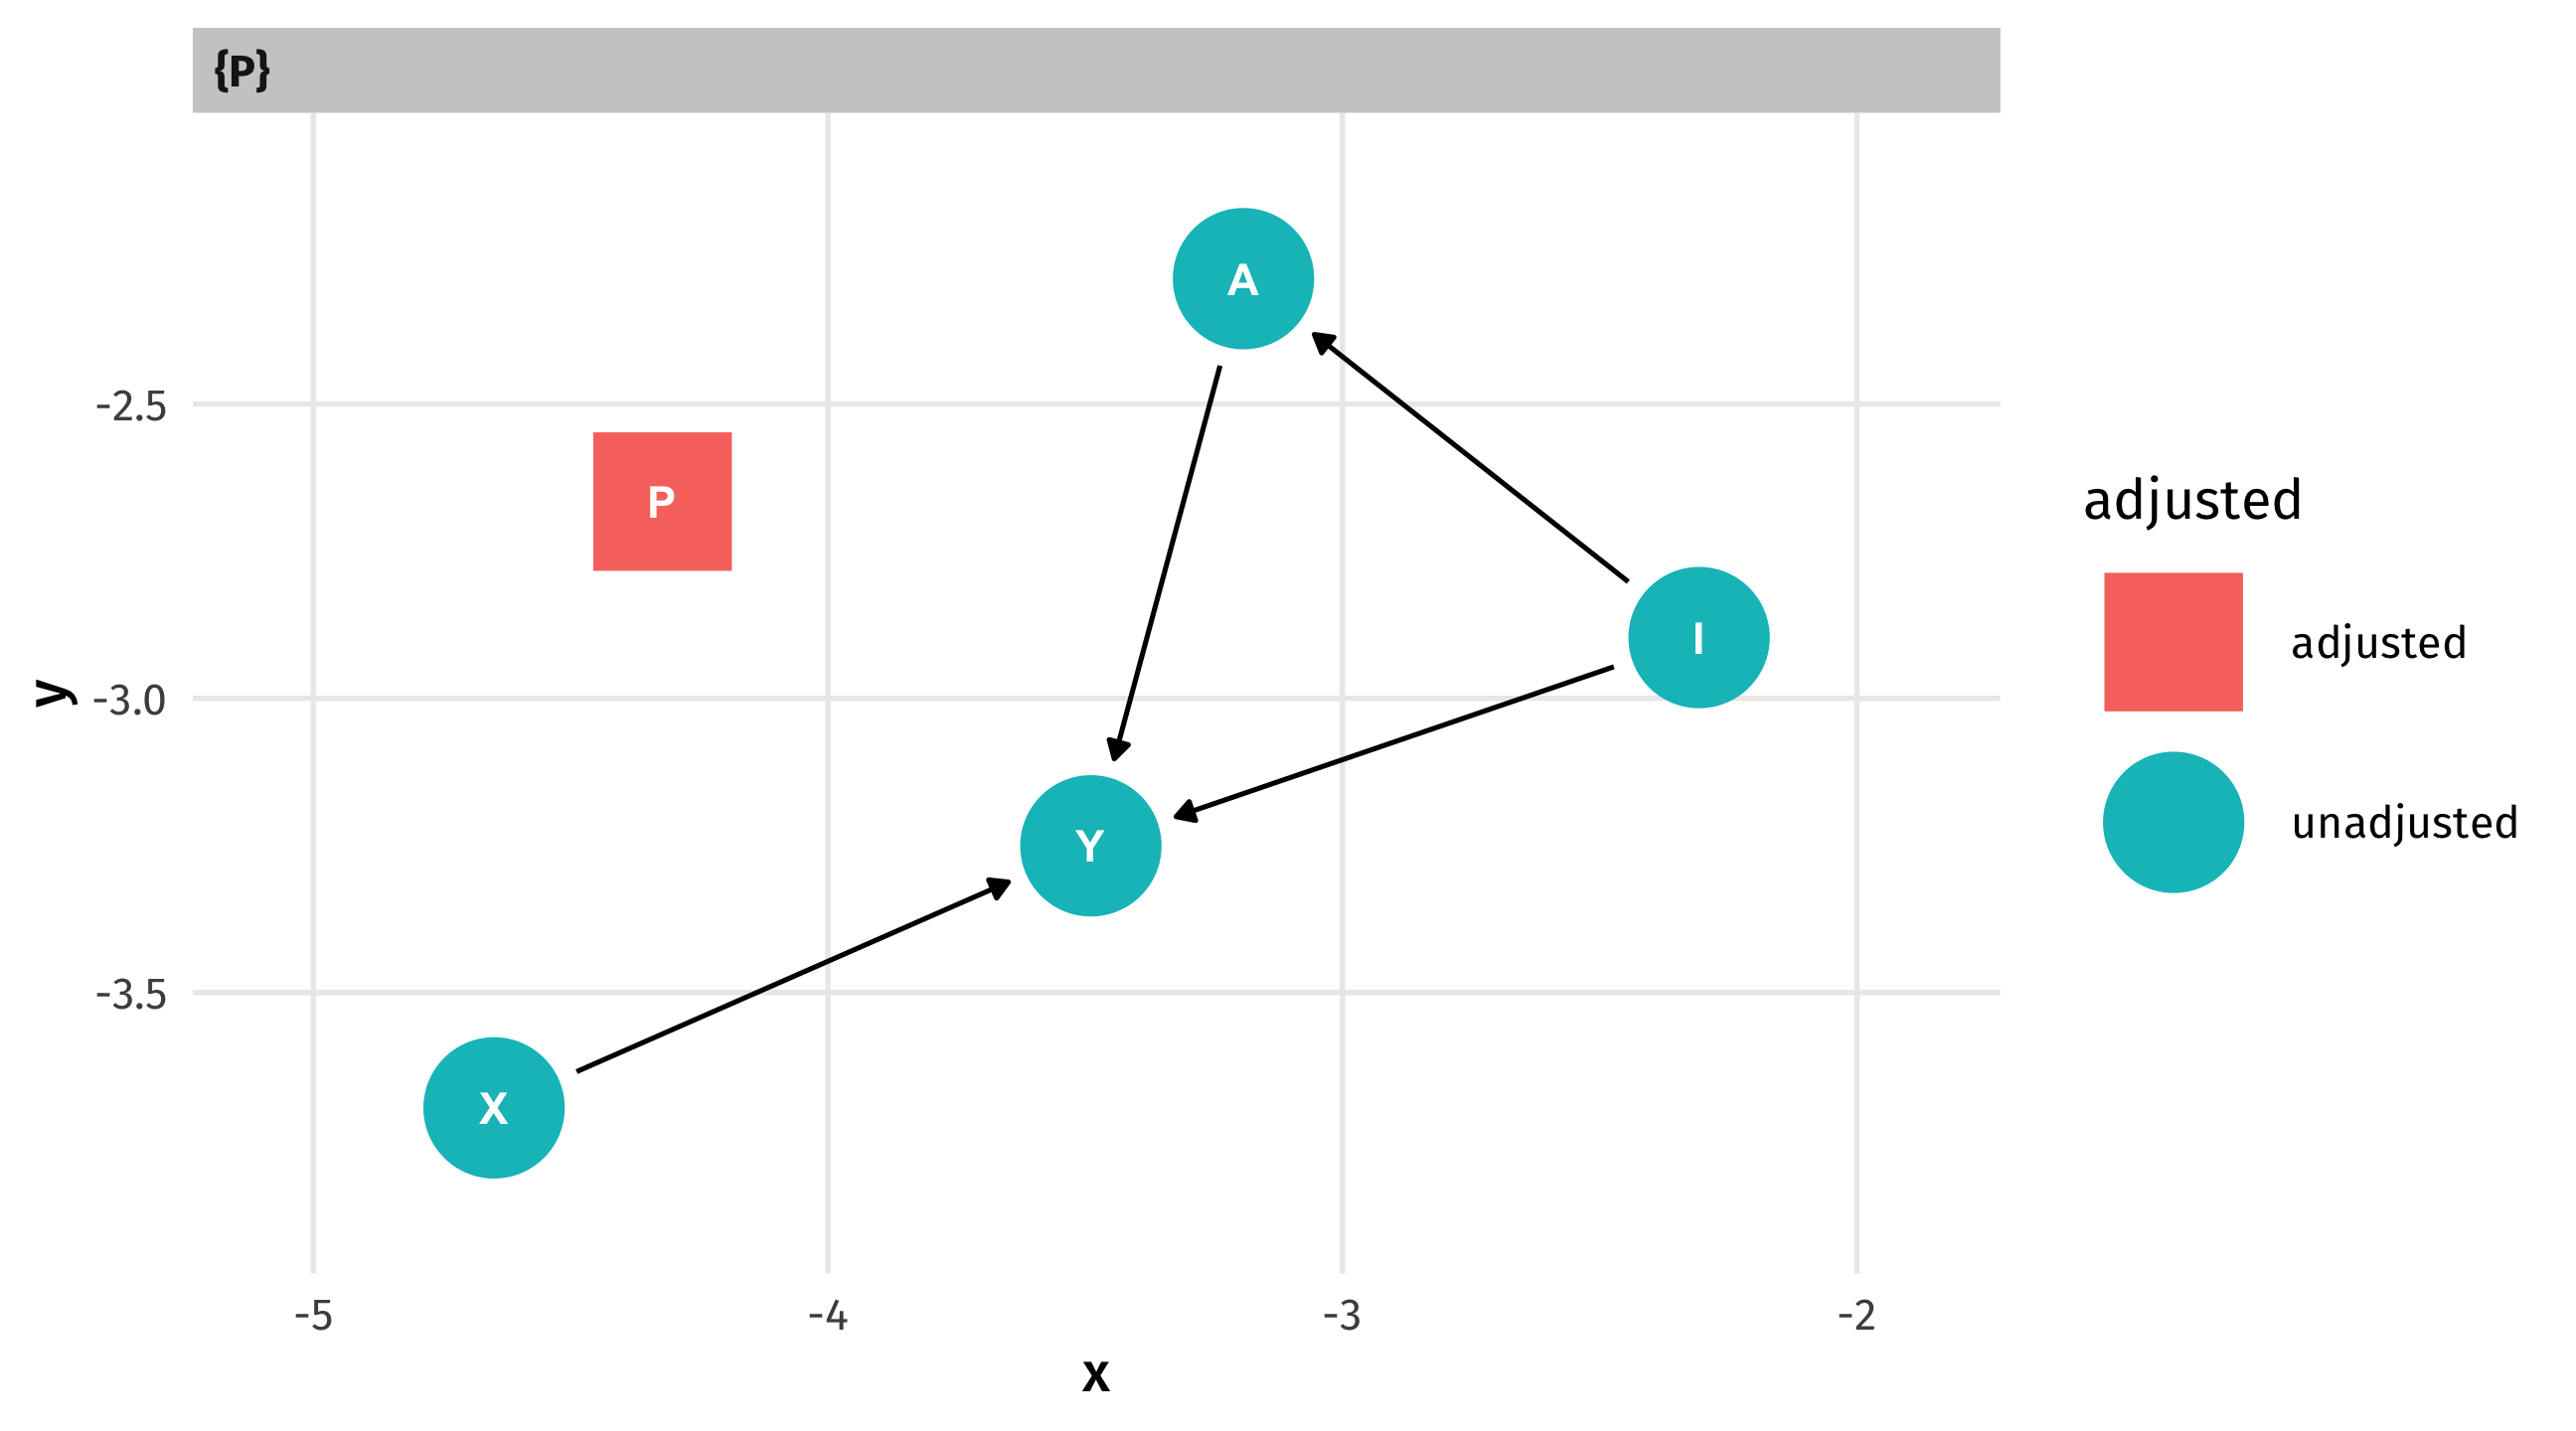
Note
“Adjust for” and “control for” are synonyms
Optional: clean it up
Can add some extra code to make the graph nice:
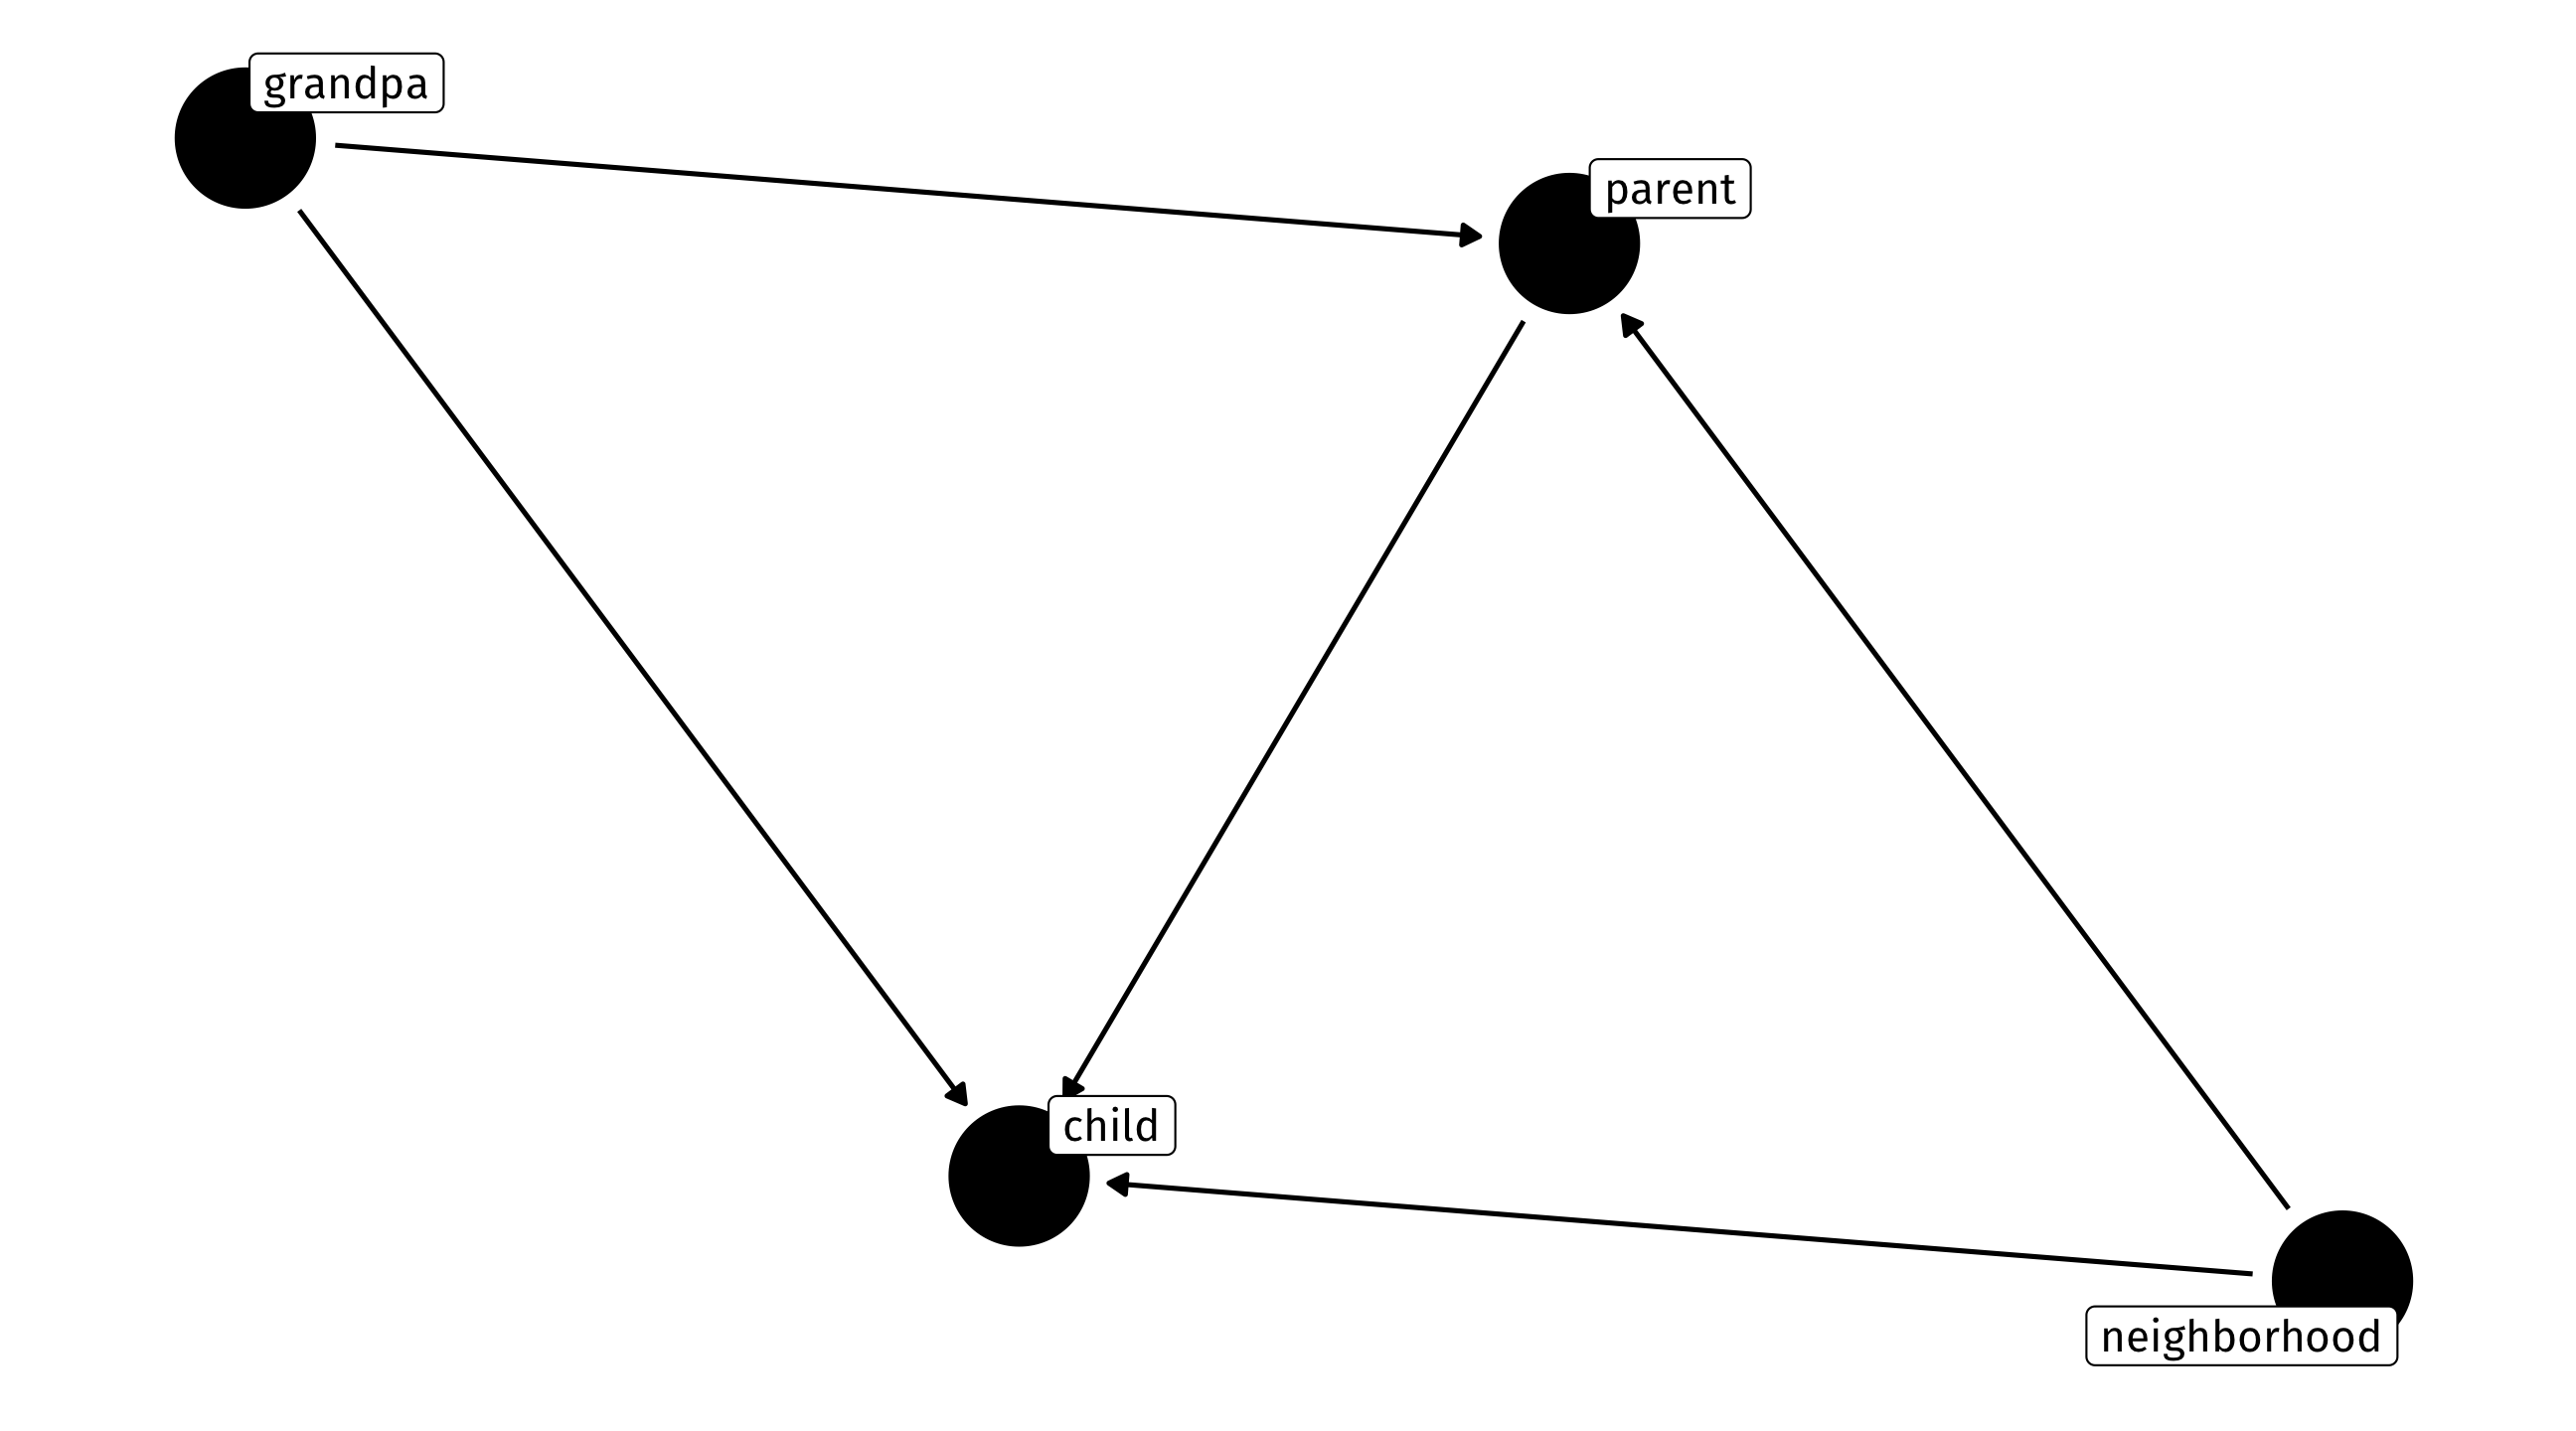
Optional: words instead of letters
We can also use words (no spaces!) instead of letters
A variable cannot cause itself
Explanation takes us into the weeds, but DAGs are acyclical, meaning: a variable cannot be its own cause (even indirectly):
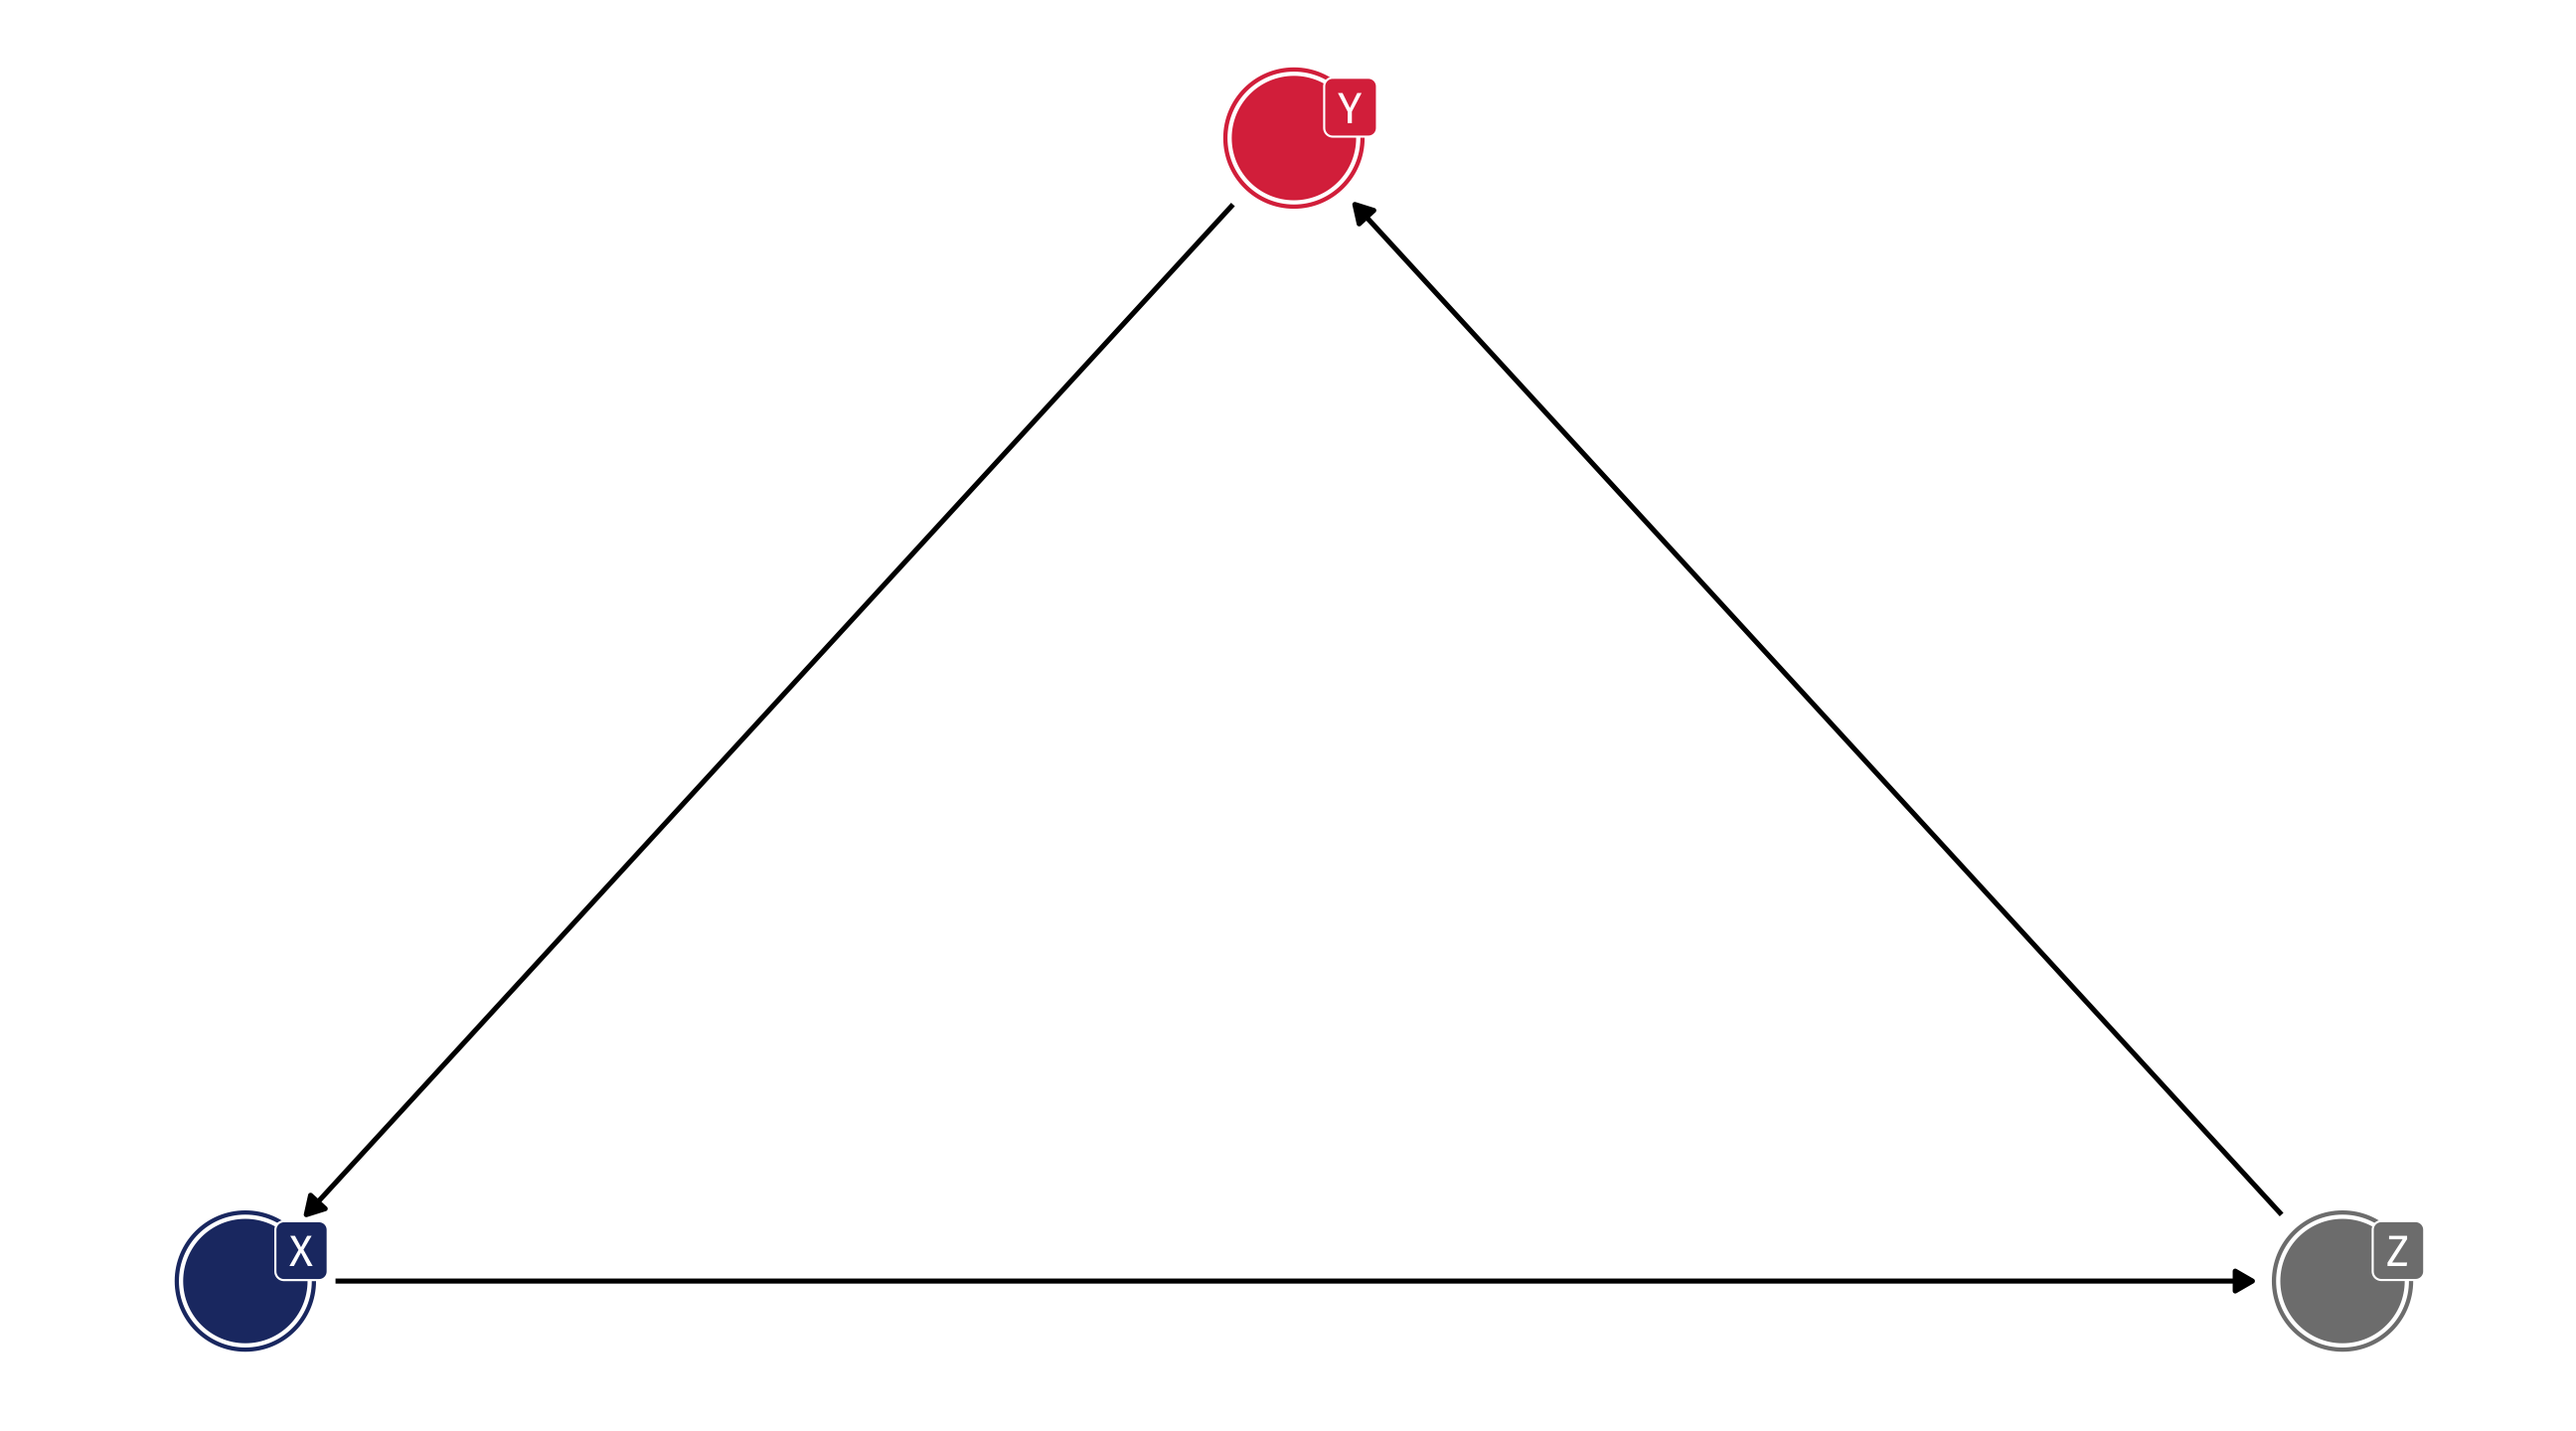
A variable cannot cause itself
If you have a cycle in your DAG, ggdag_adjustment_set() will return this: