
Causality I
POL51
September 30, 2024
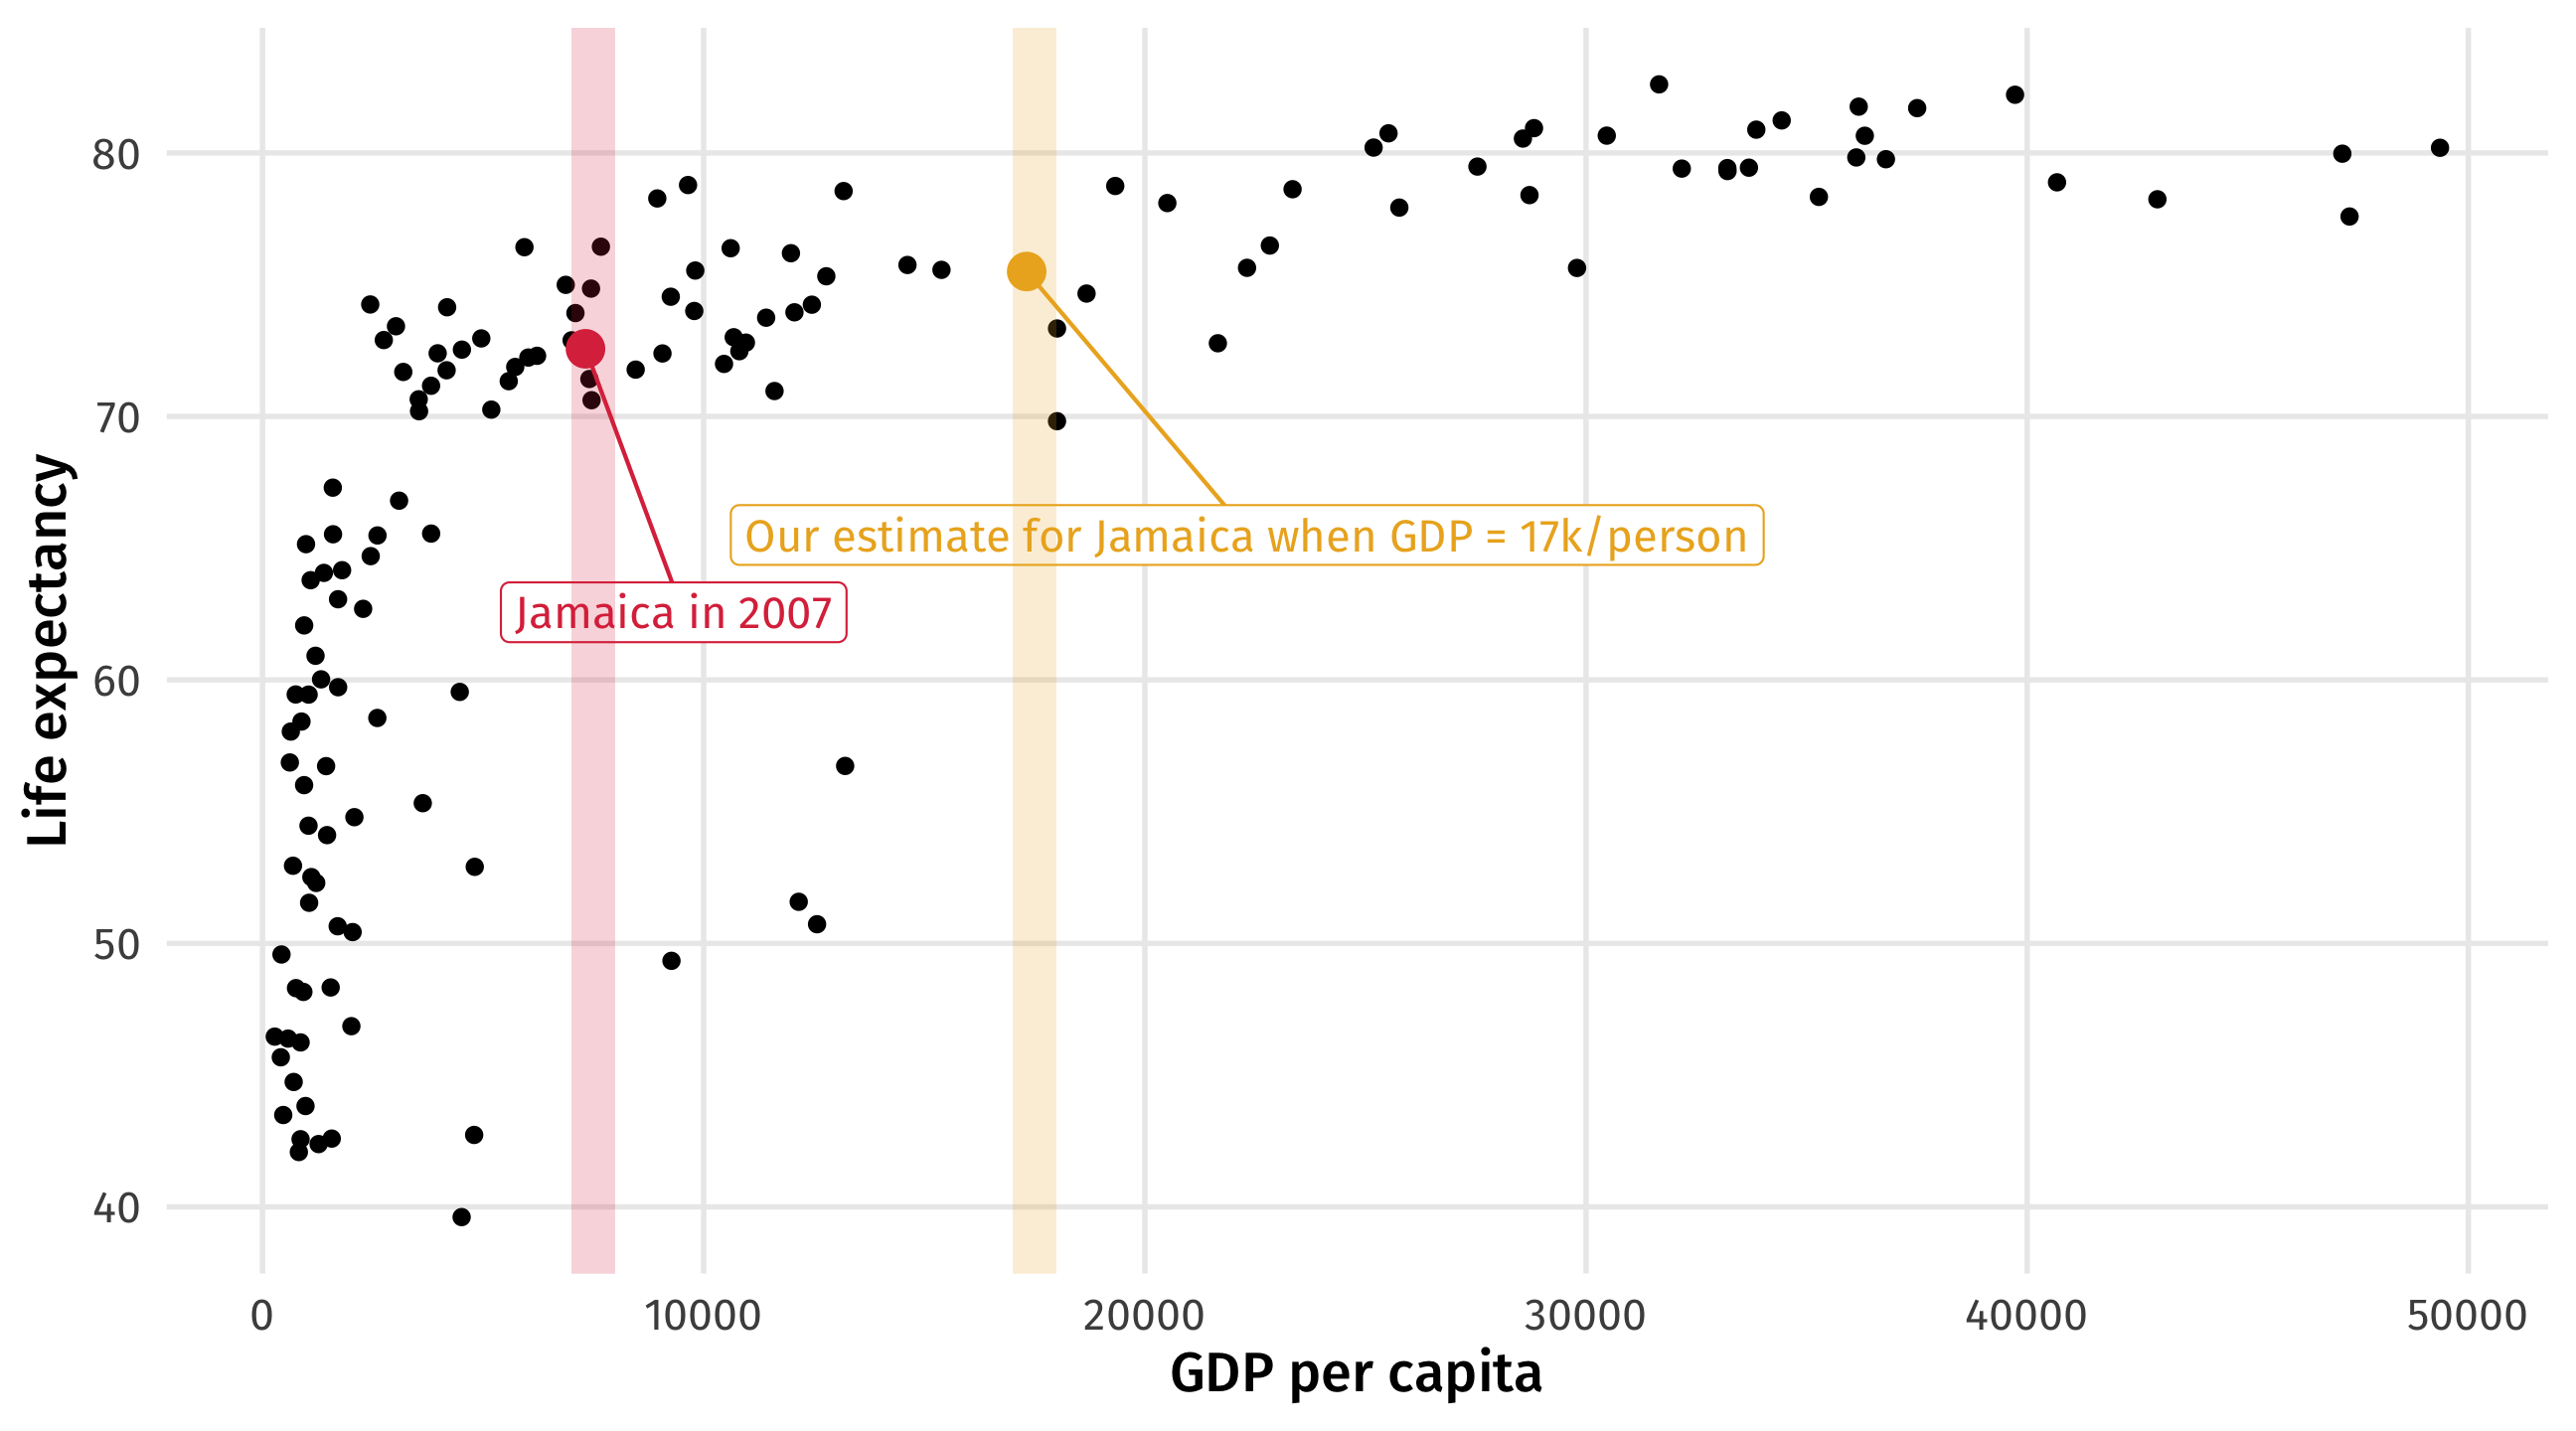
Prediction is for making decisions
World Bank: what would happen to Jamaica if their GDP went up by 10k? We can use models to make an educated guess
First half of course
How to program, visualize data, modeling, relationships, etc.
Look at all the functions you “learned”:
group_by,tally,summarise,filter,mutate,%>%,distinct,lm,augment,tidy,ggplot,facet_wrap…
- There are thousands more!

Second half of the course
“How do we know if X causes y?”
Are our estimates causal? Academics fight about this all day!
This question is at center of causal inference
We will learn why it is so difficult to establish causality with data
We will also learn potential solutions

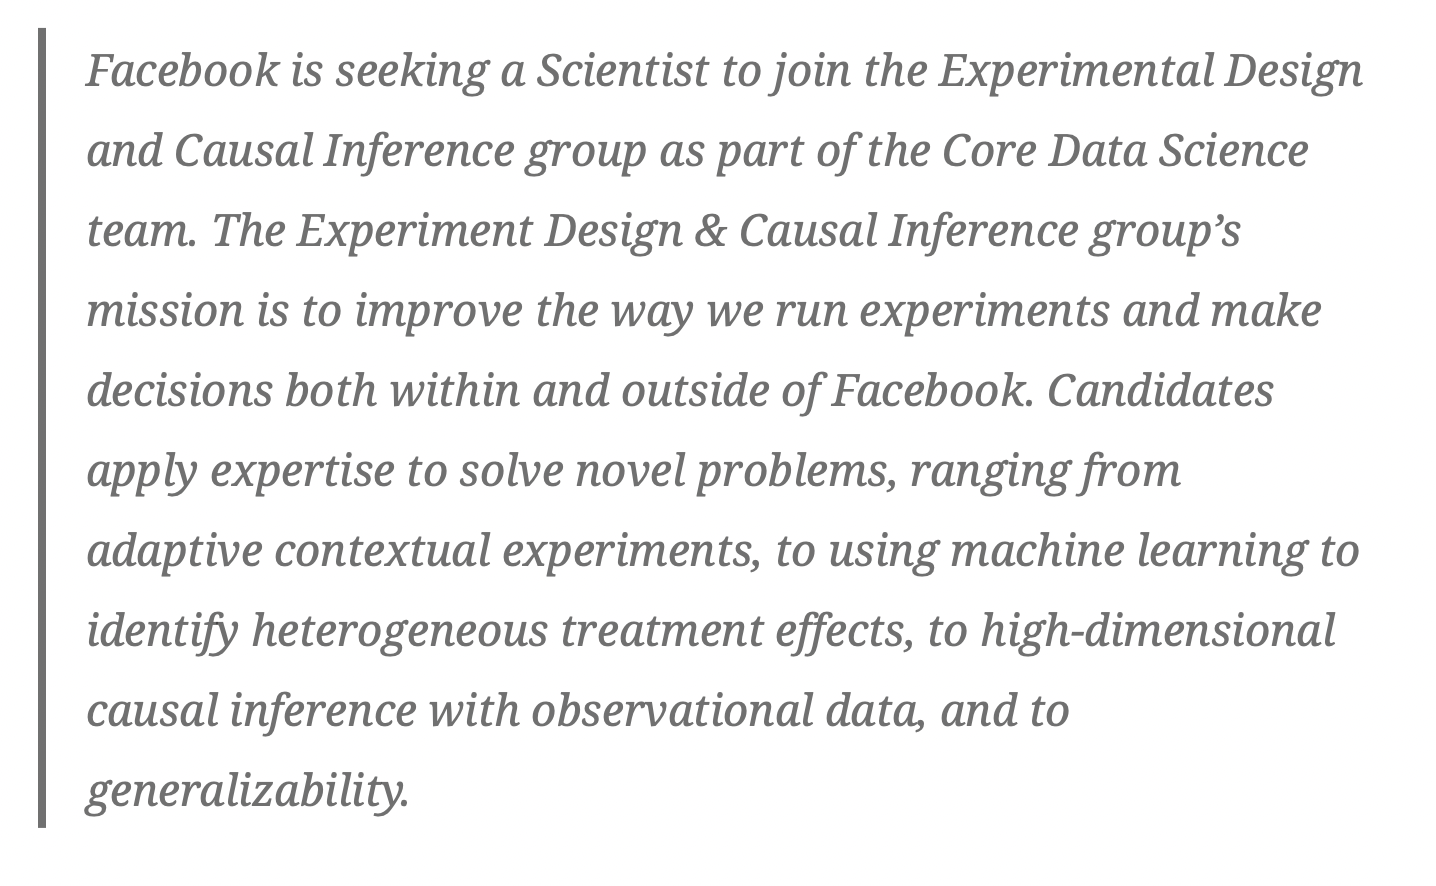
The value of causality
One of our comparative advantages
Not just academic; companies, governments, NGOs also need to answer “why” questions
Does this policy work (or not)? Did it do what was intended? How effective or counterproductive was it?
What do we mean by causality?
In this class, we say X causes Y if…
An intervention that changes the value of X produces a probabilistic change in Y
Intervention = X is being changed or altered
Probabilistic = Y should change, on average, but need not in every instance

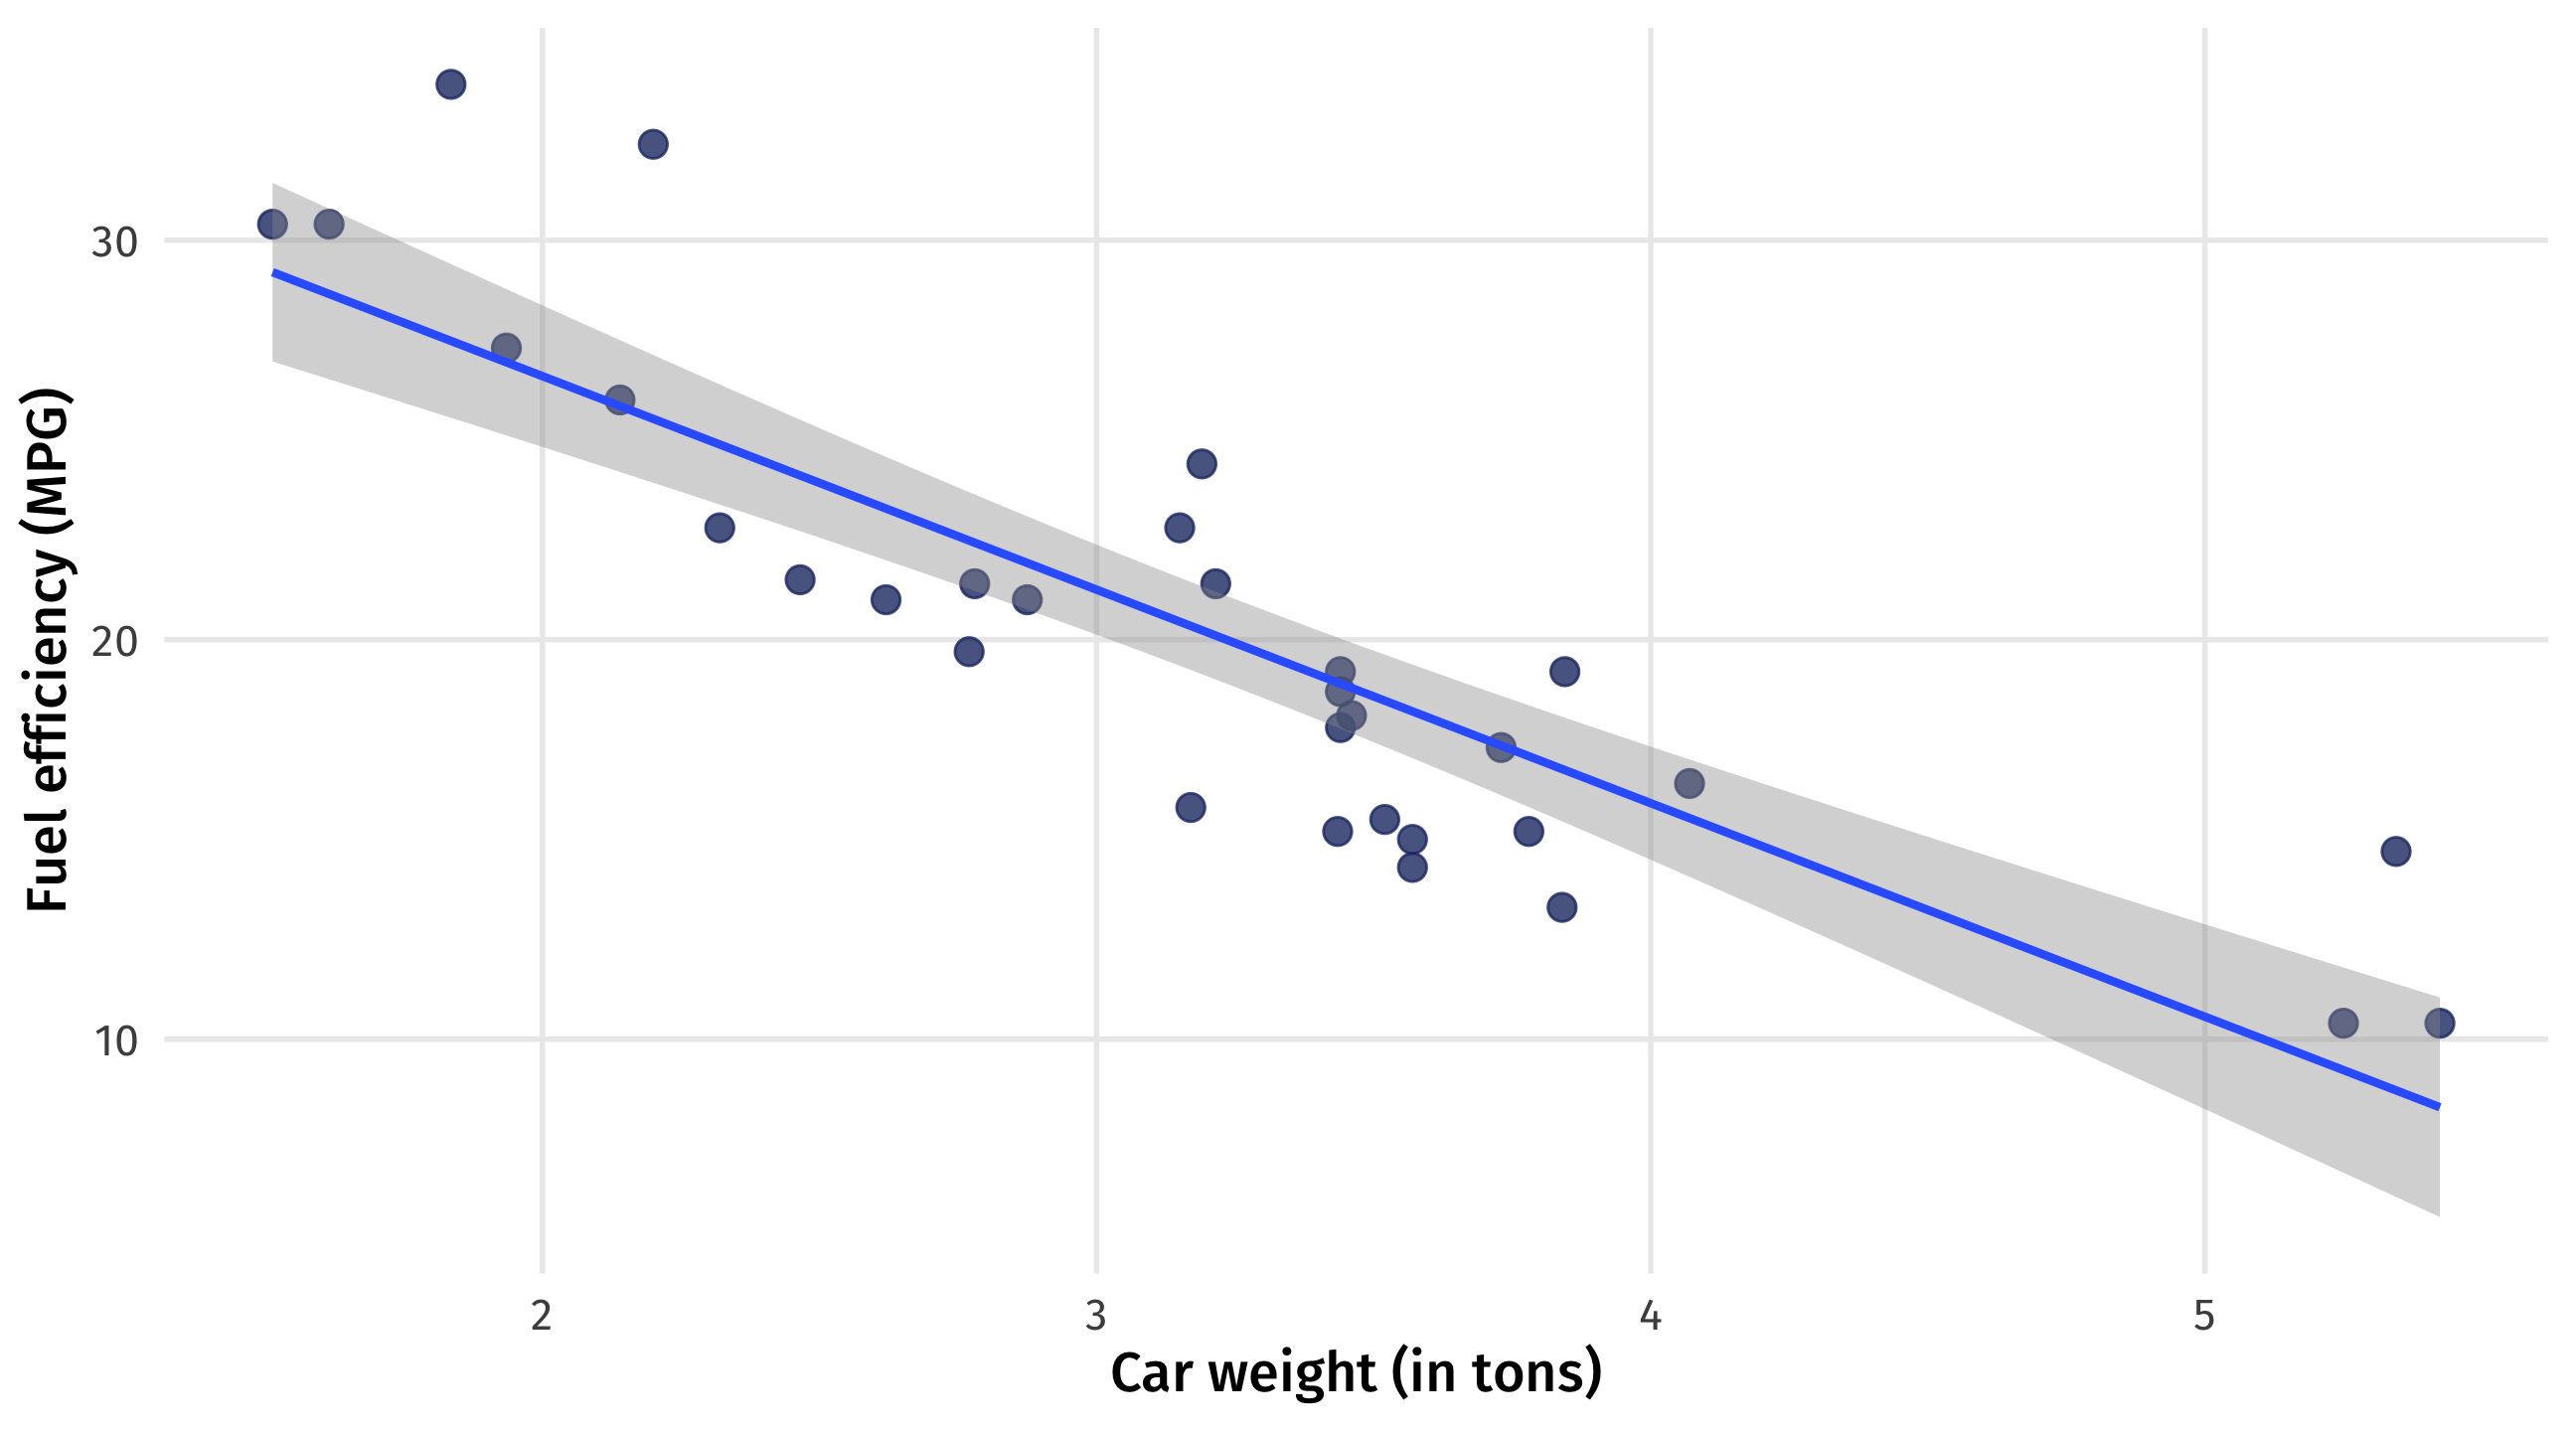
Obviously causal relationships
A heavier car has to work harder to get from A to B
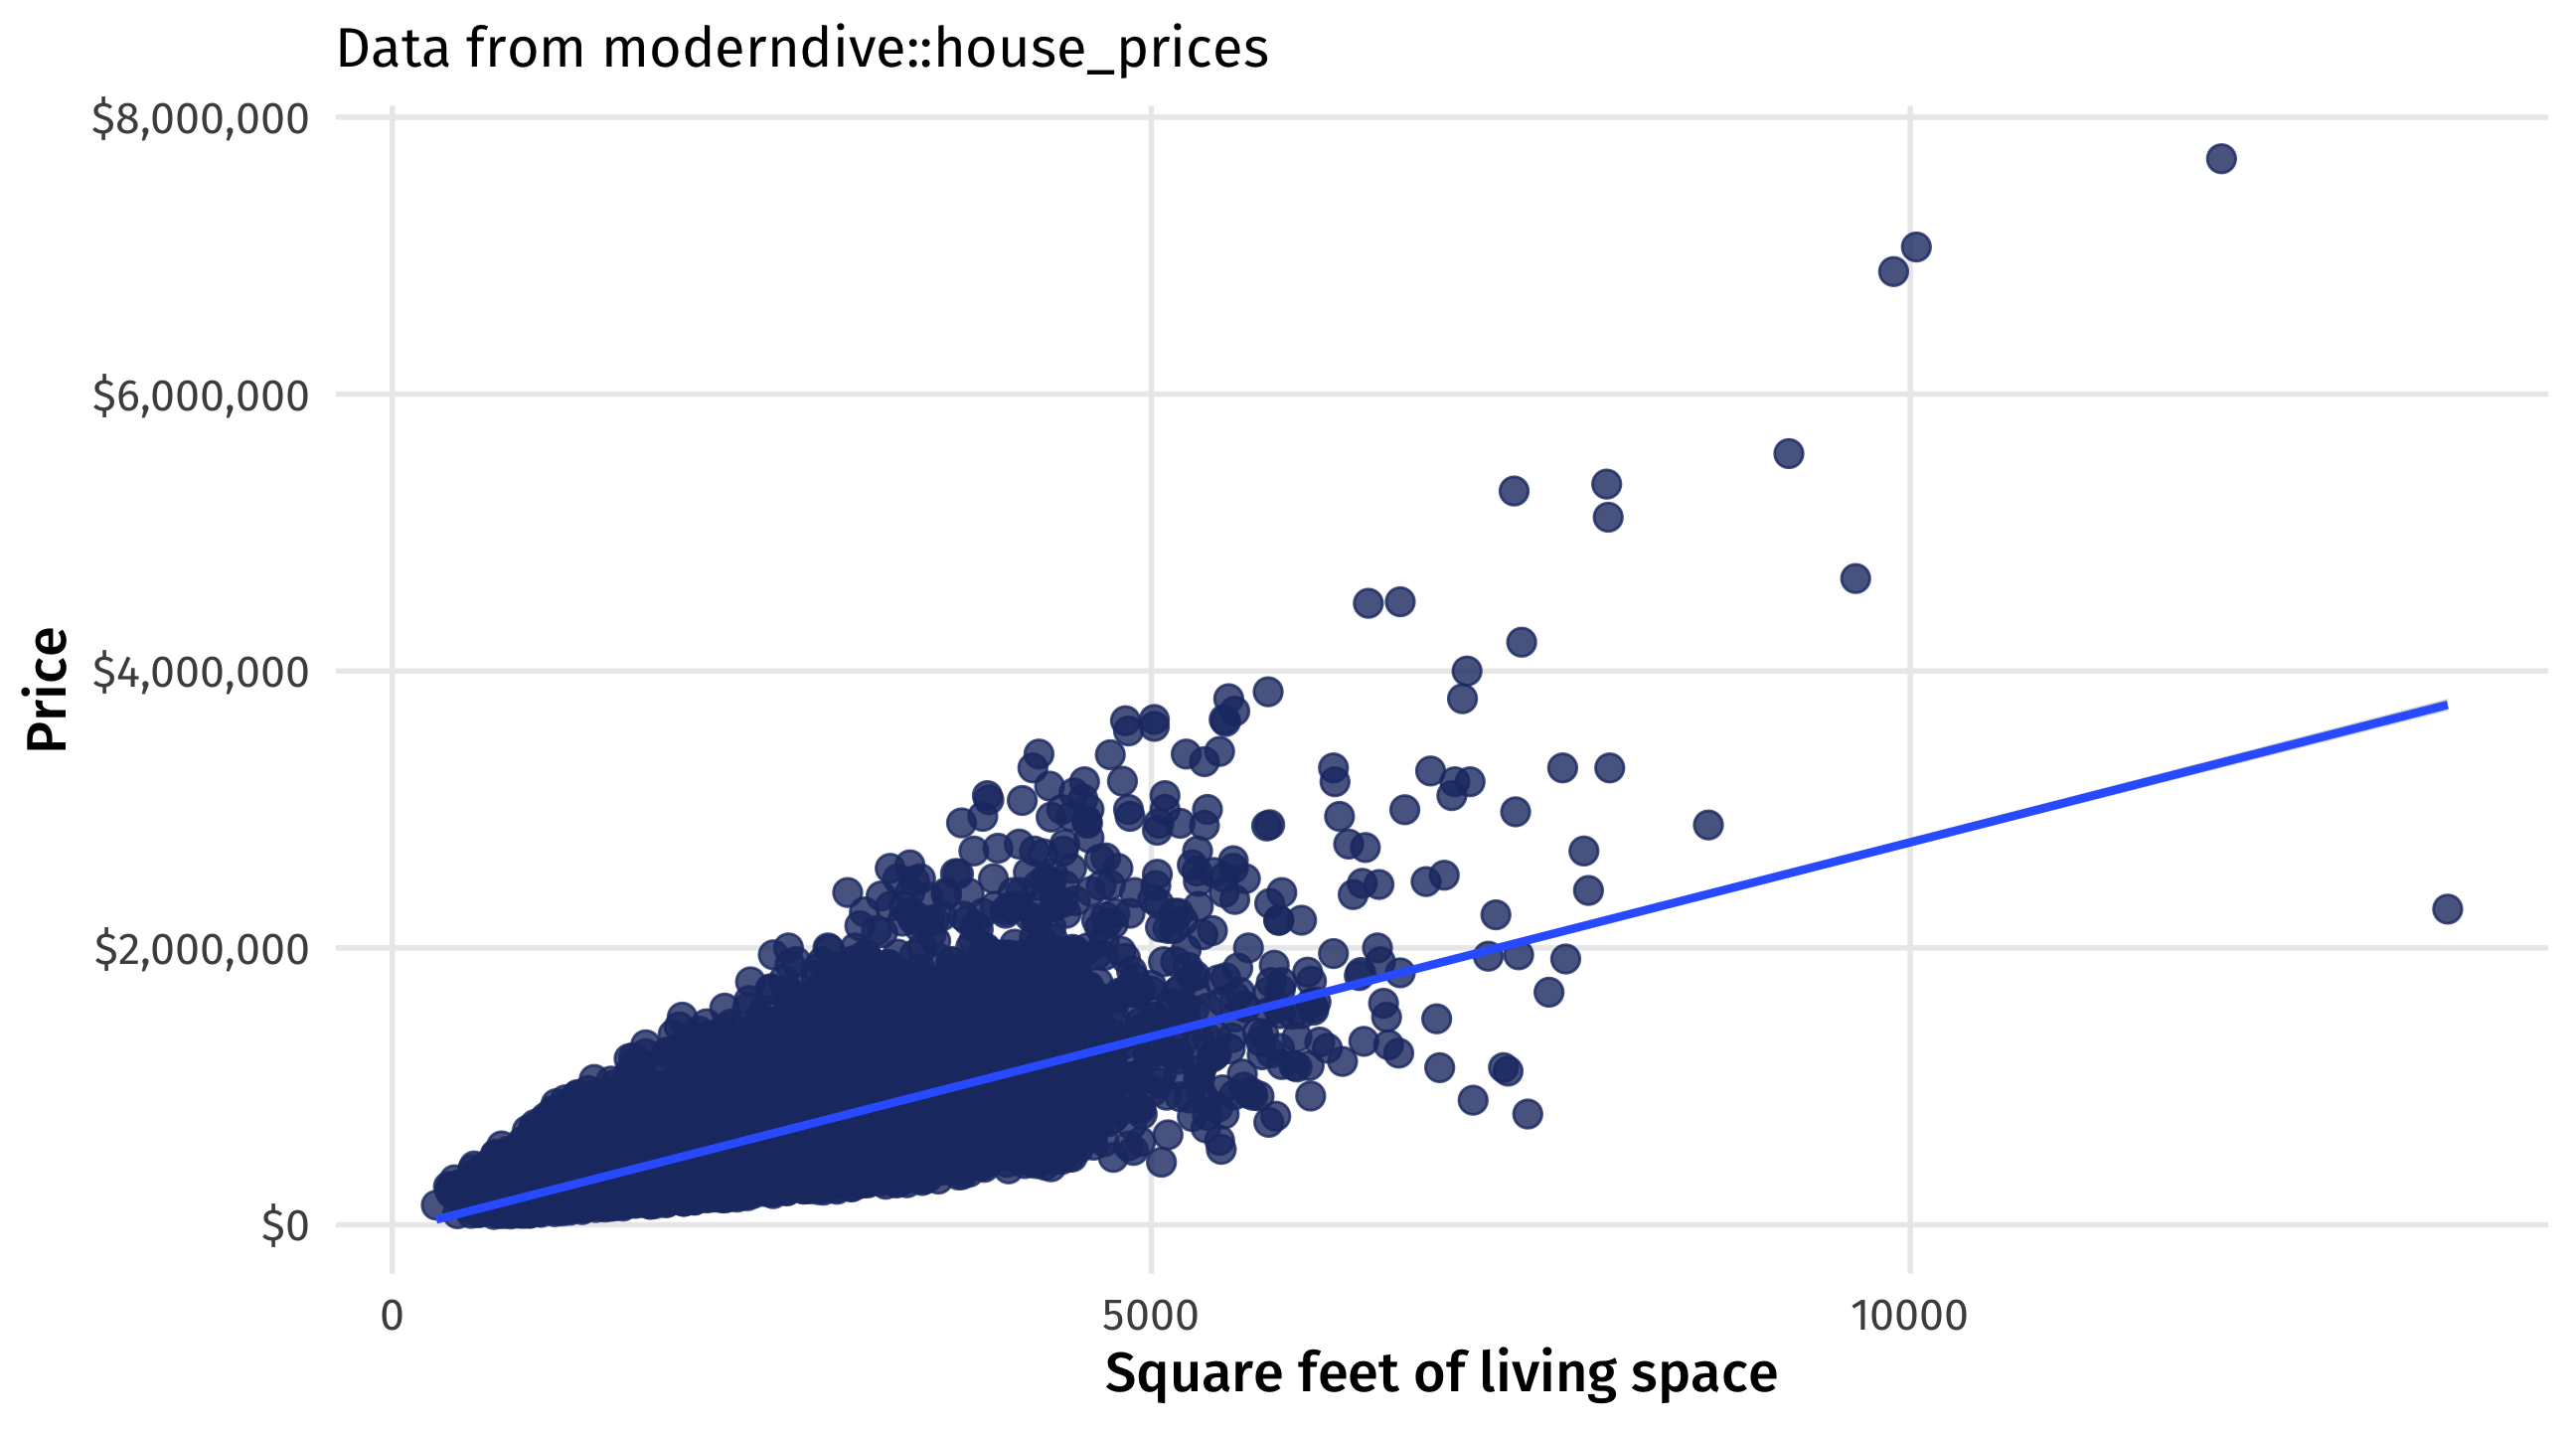
Obviously causal relationships
A bigger house is more desirable
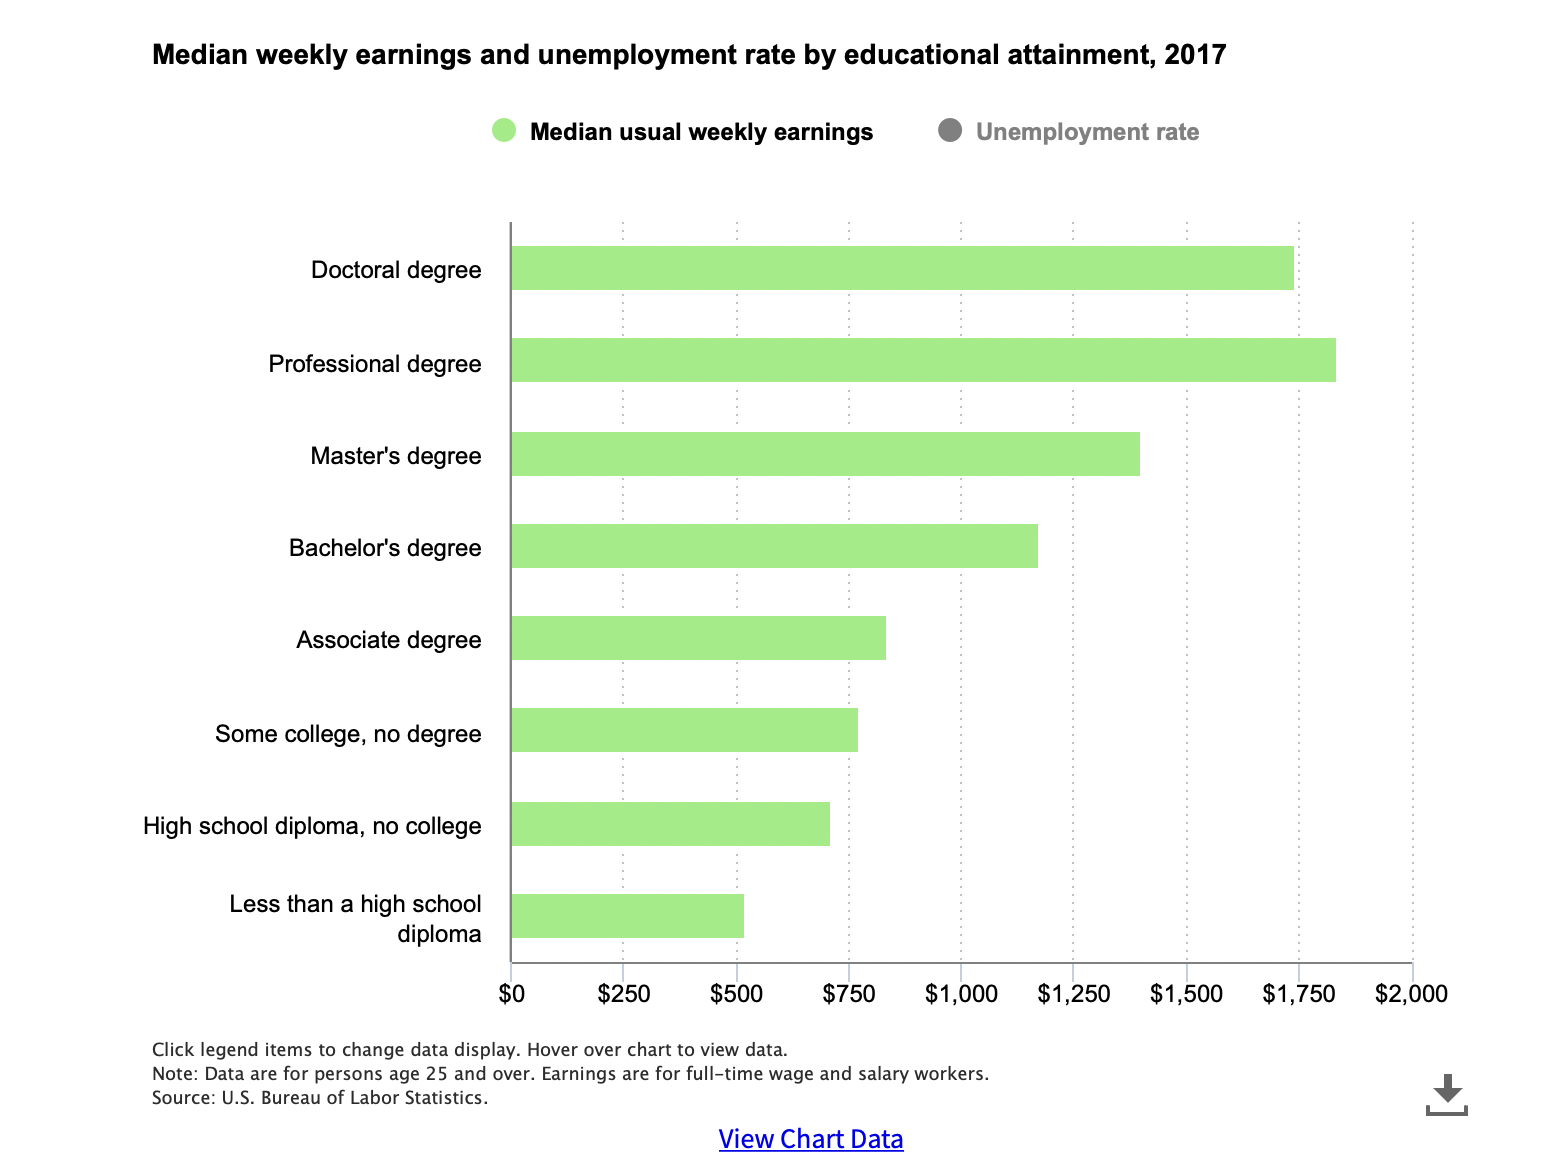
Not obvious: education and earnings
- Positive correlation between education and earnings, yet
- People who are already wealthy (or likely to become wealthy) get more education than people who are not wealthy
- In other words: people self-select into education levels
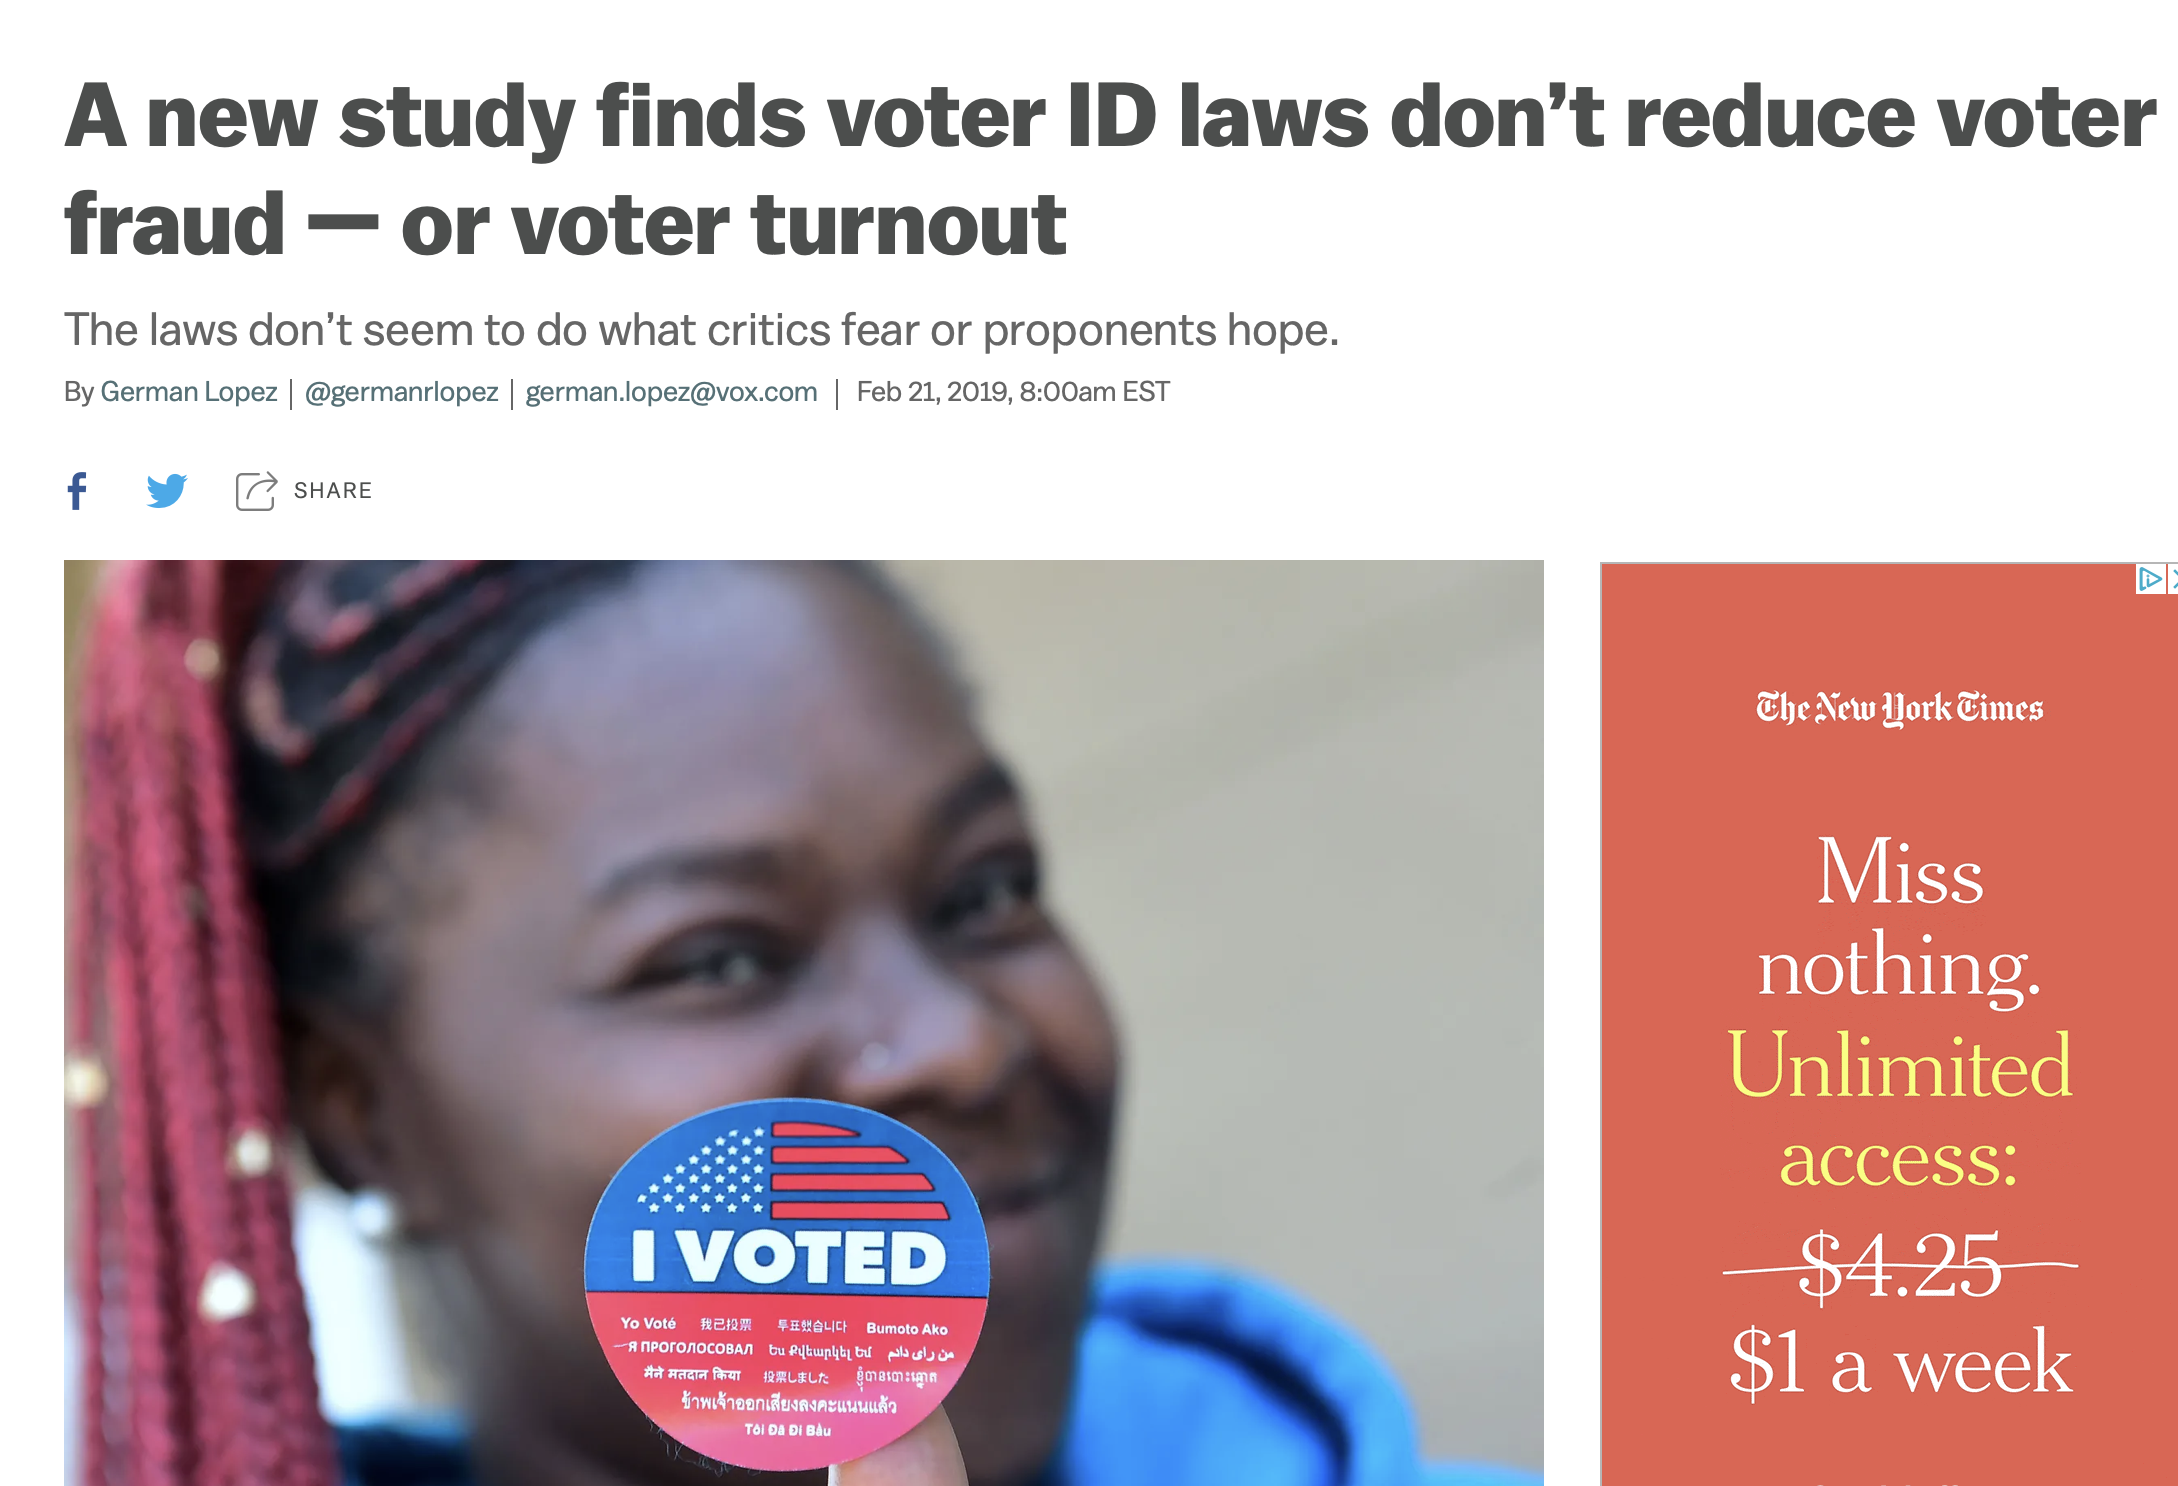
Not obvious: voter ID and turnout
States that pass these laws are different from states that don’t pass these laws
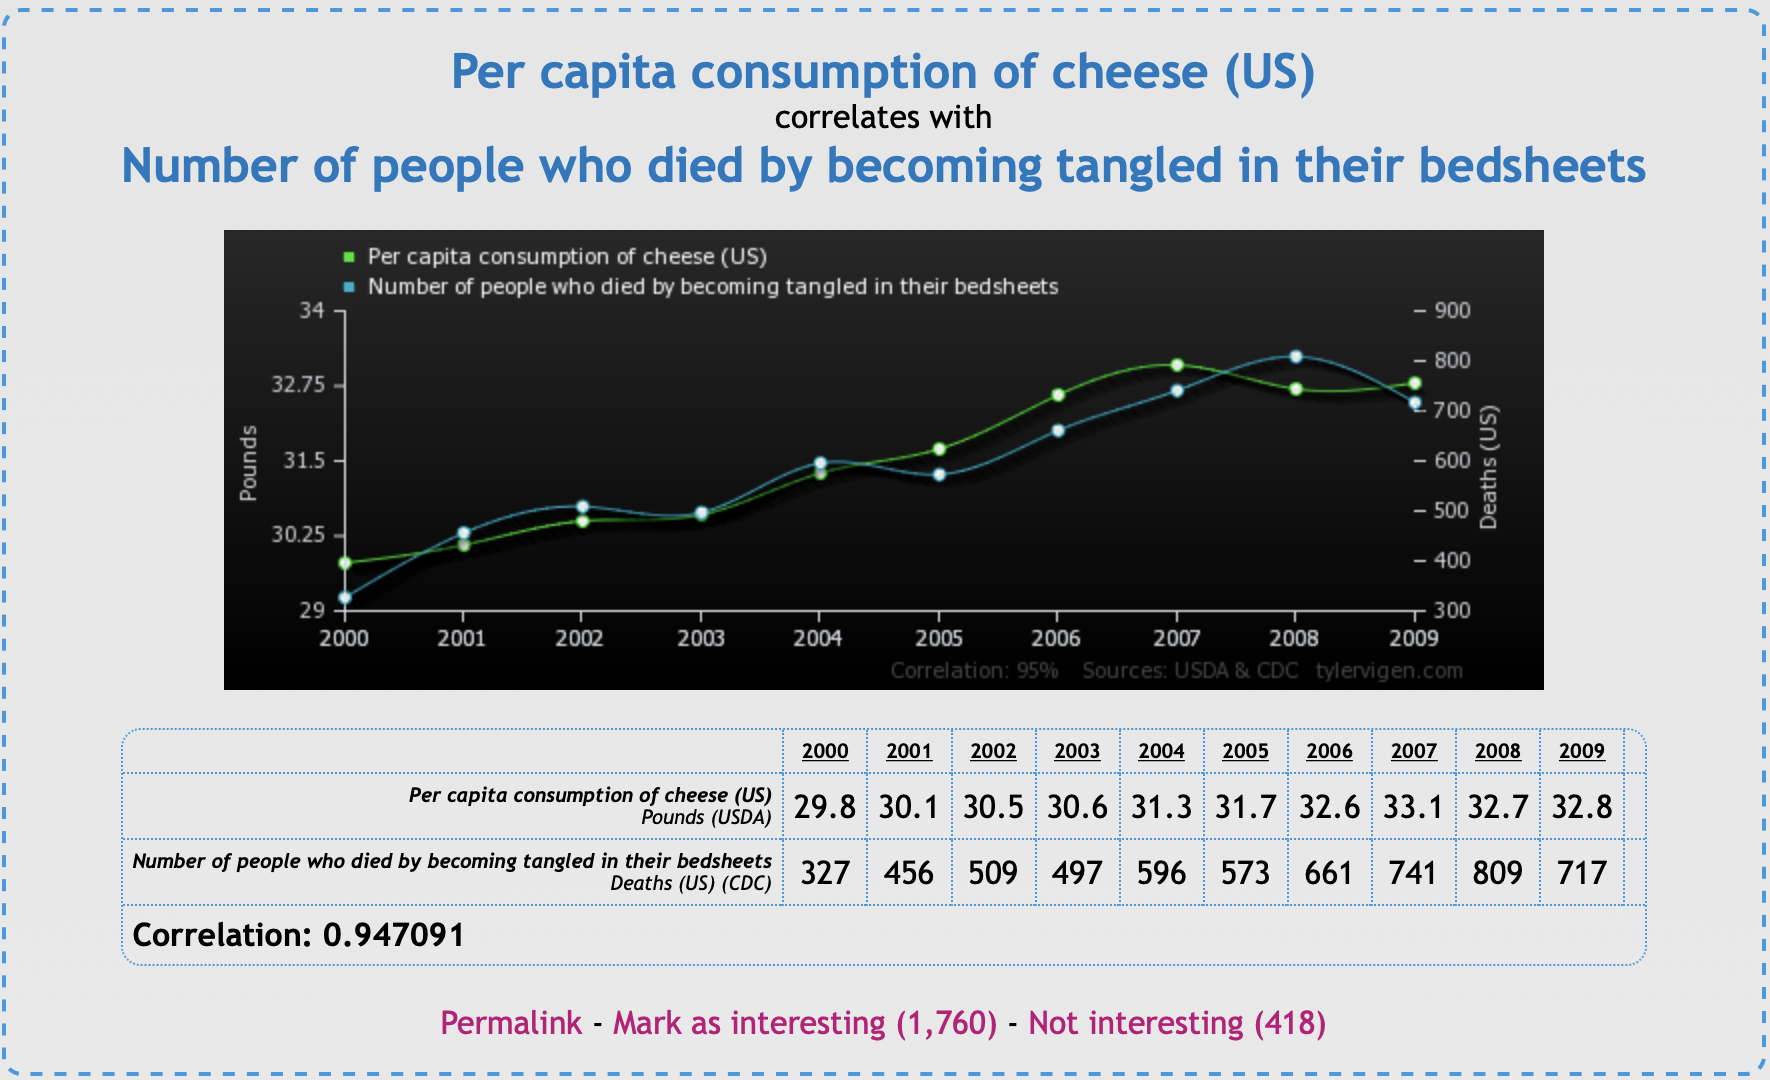
Spurious correlation
To make matters worse, correlation is common-place in nature:
First step: yes, we can tell (sometimes)
Students are obsessed with “correlation does not mean causation”
But sometimes it does! that’s the tricky part
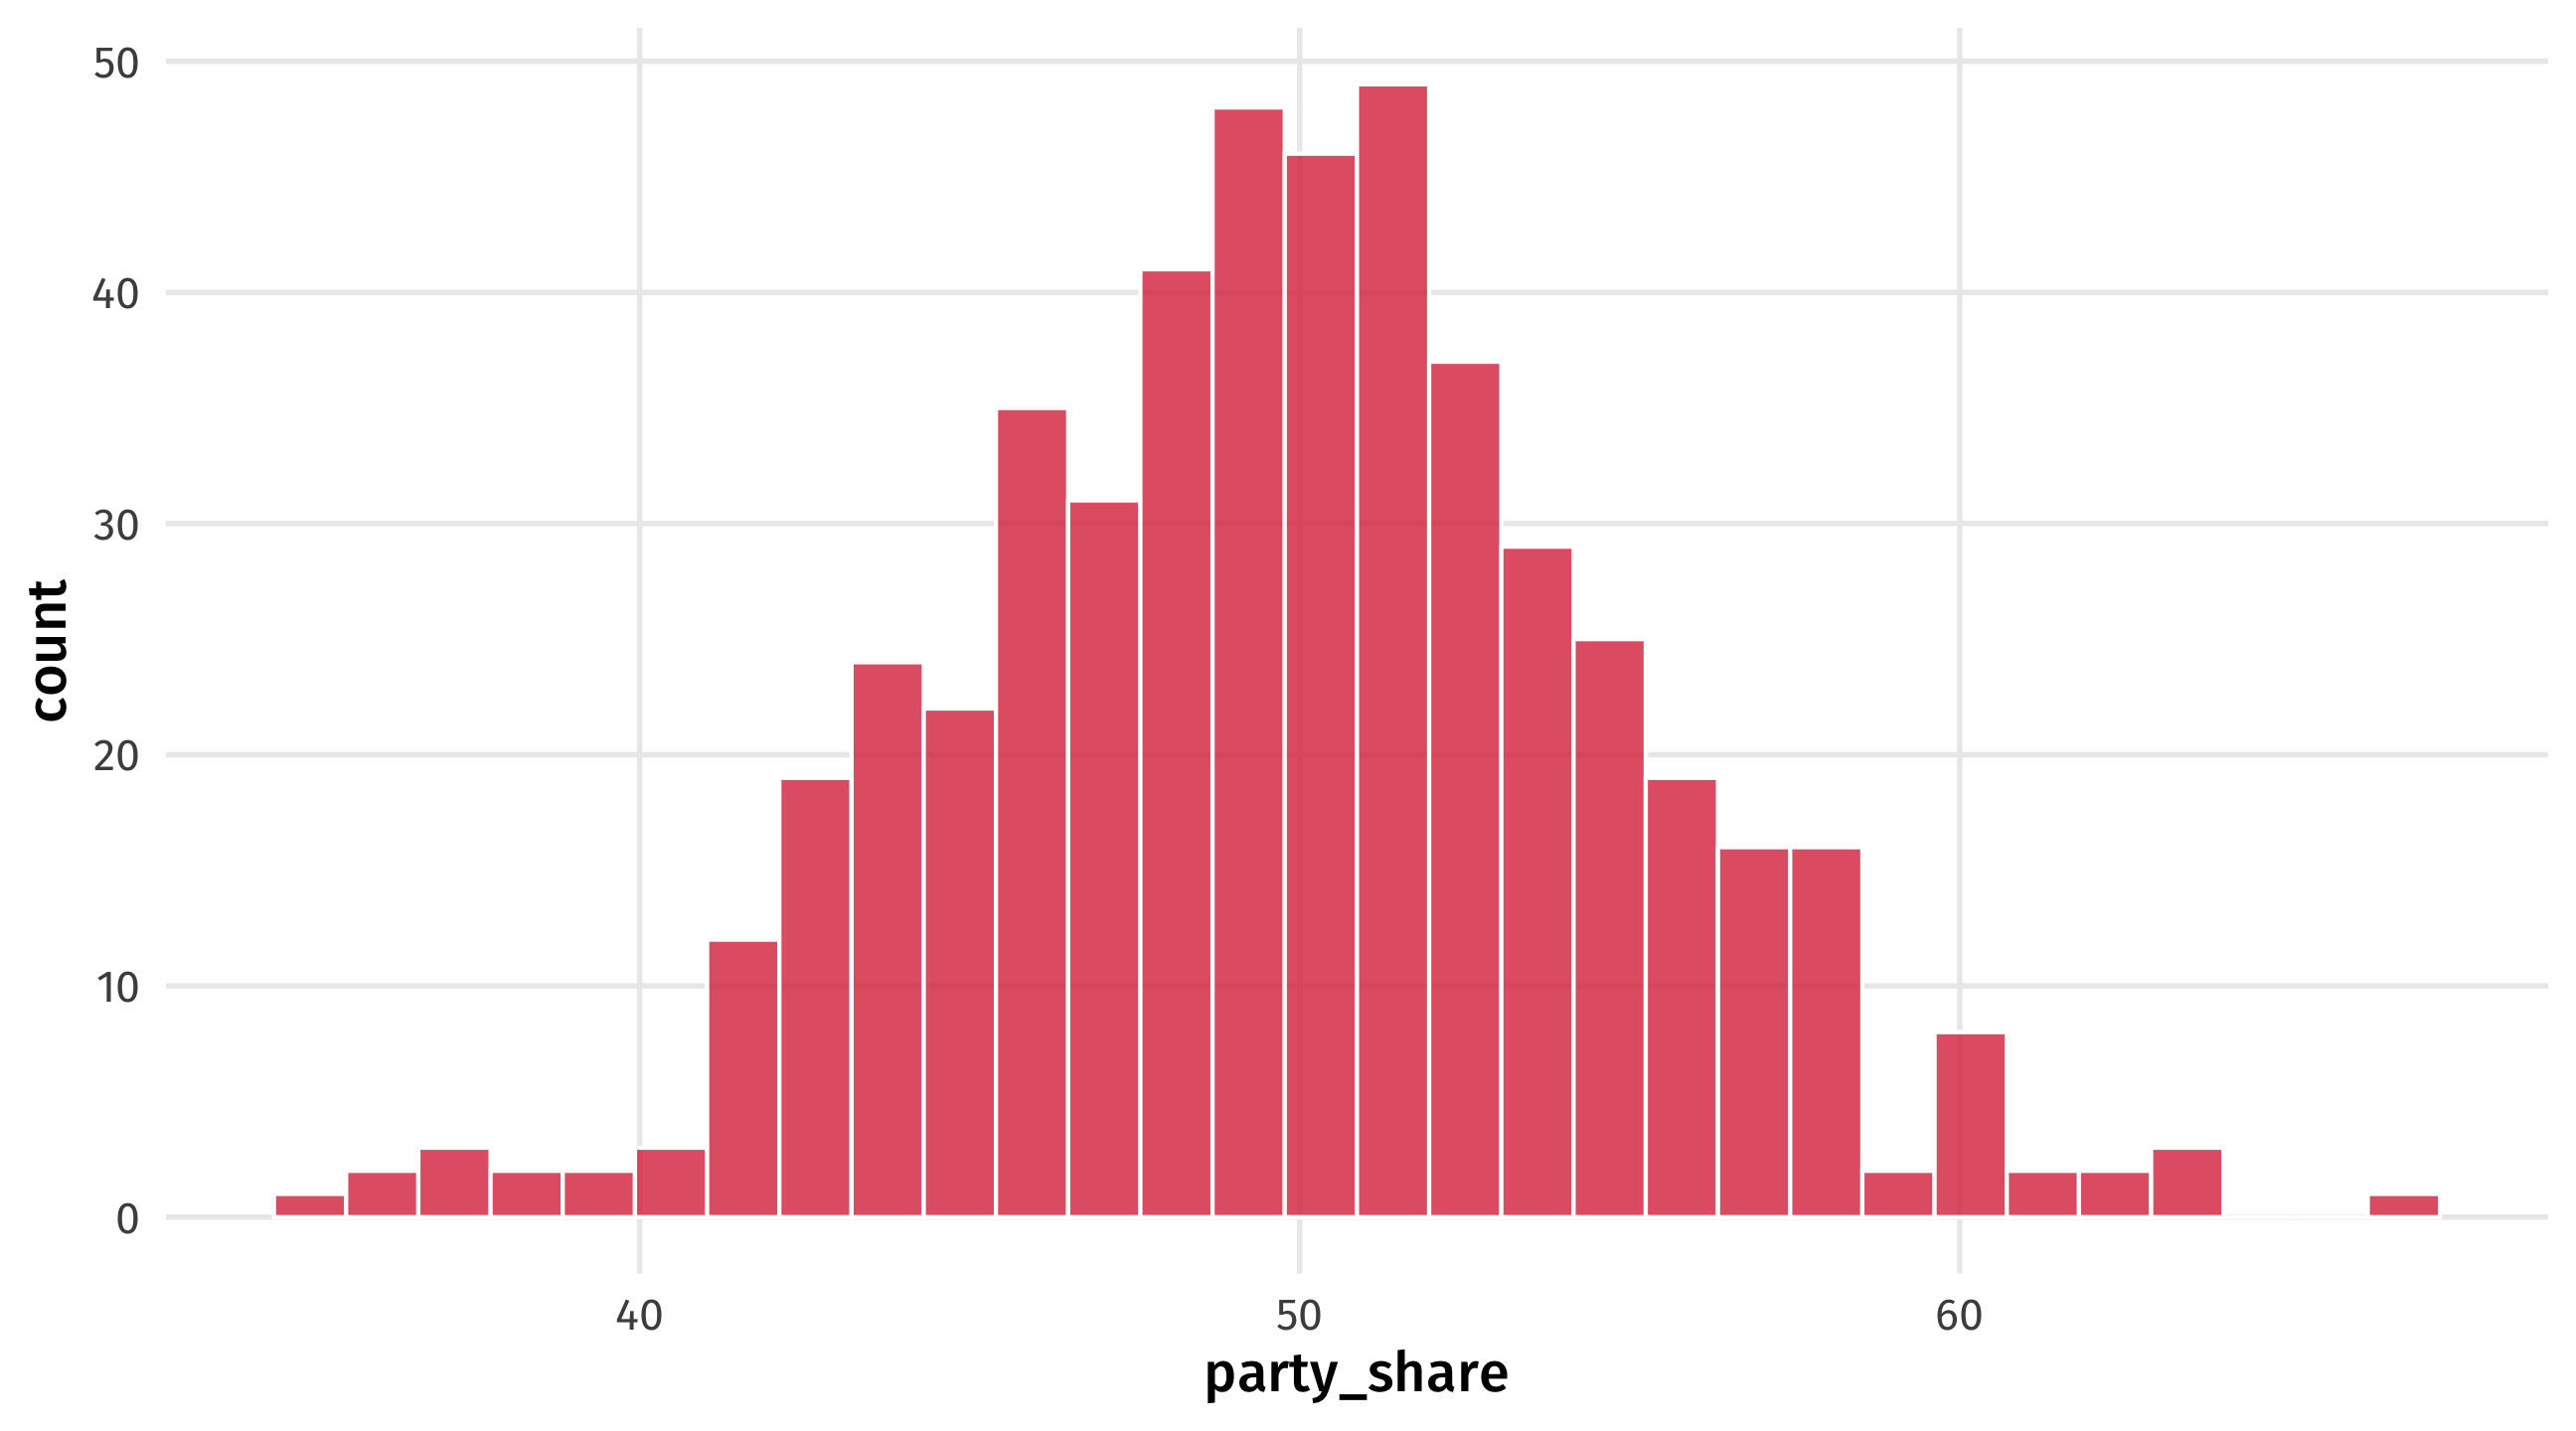
Make up (simulate) data to convince ourselves
- A good way to see that we correlation can equal causation is to make up (simulate) data where we know that X causes Y
- We can make up data in R with the
rnorm()function rnorm()draws random numbers from a normal distribution- The numbers it makes up are pretty close to some mean, plus or minus a standard deviation
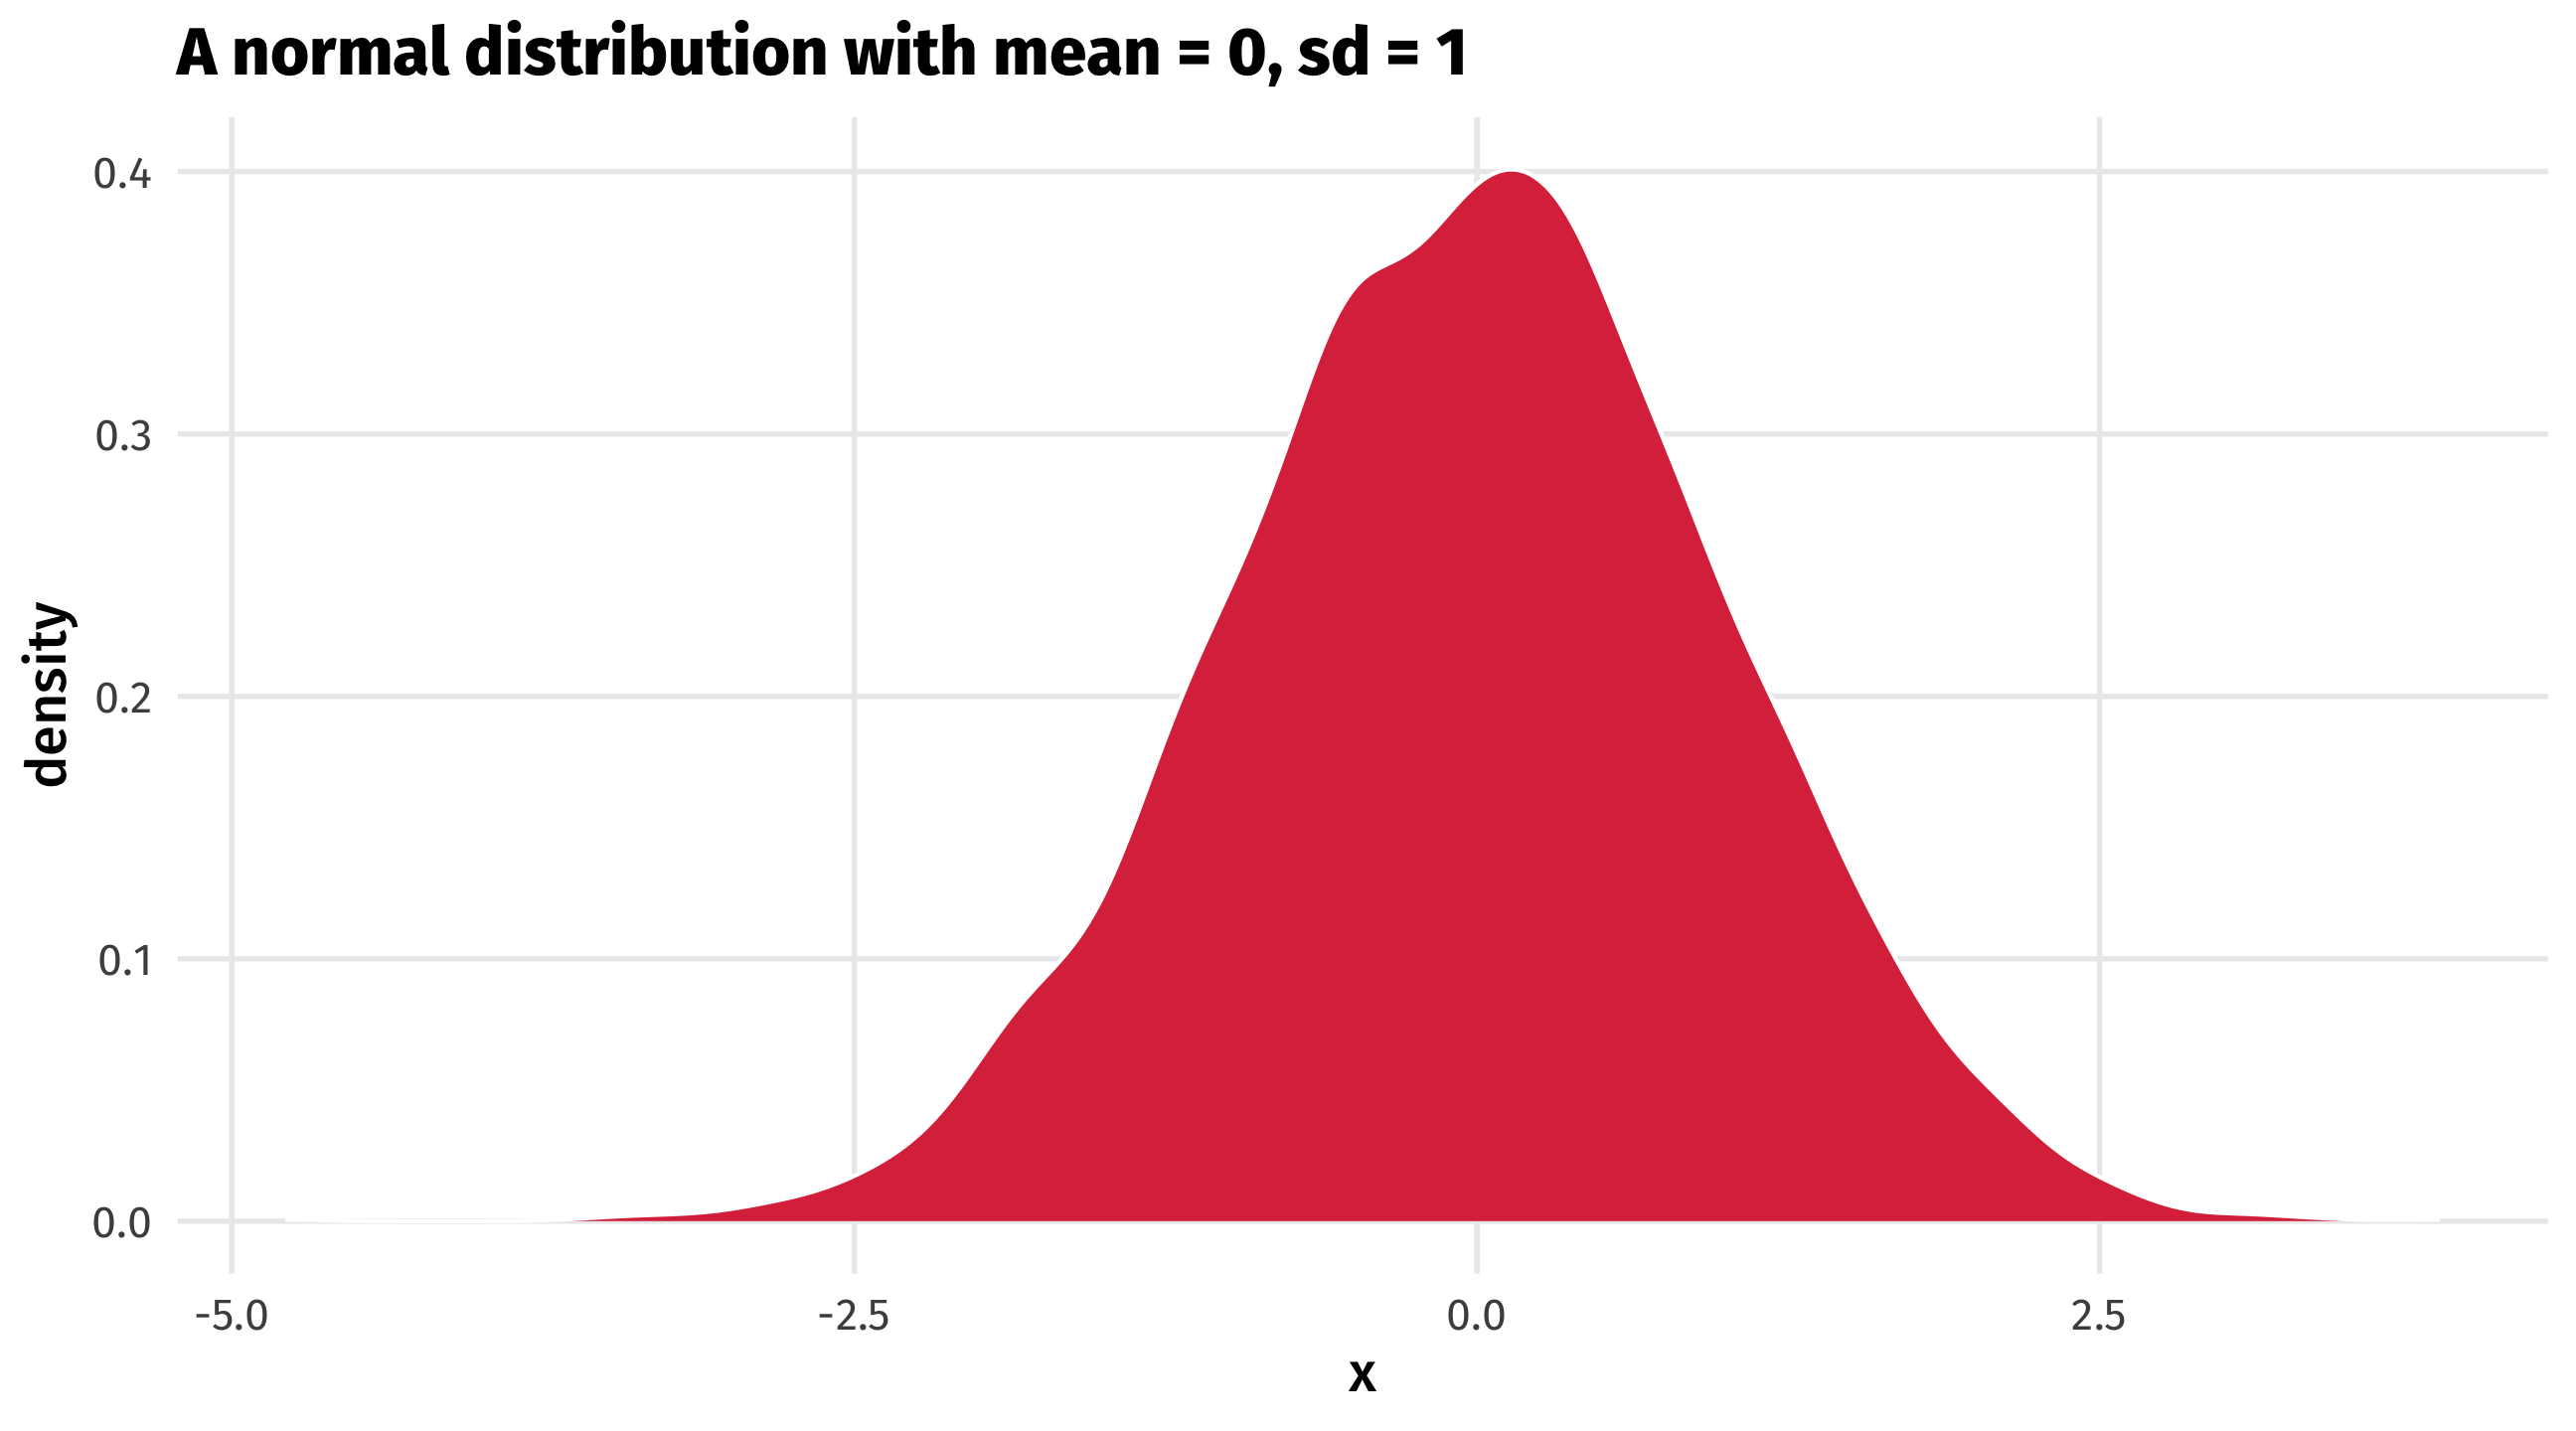
And we can plot it
And we can plot it
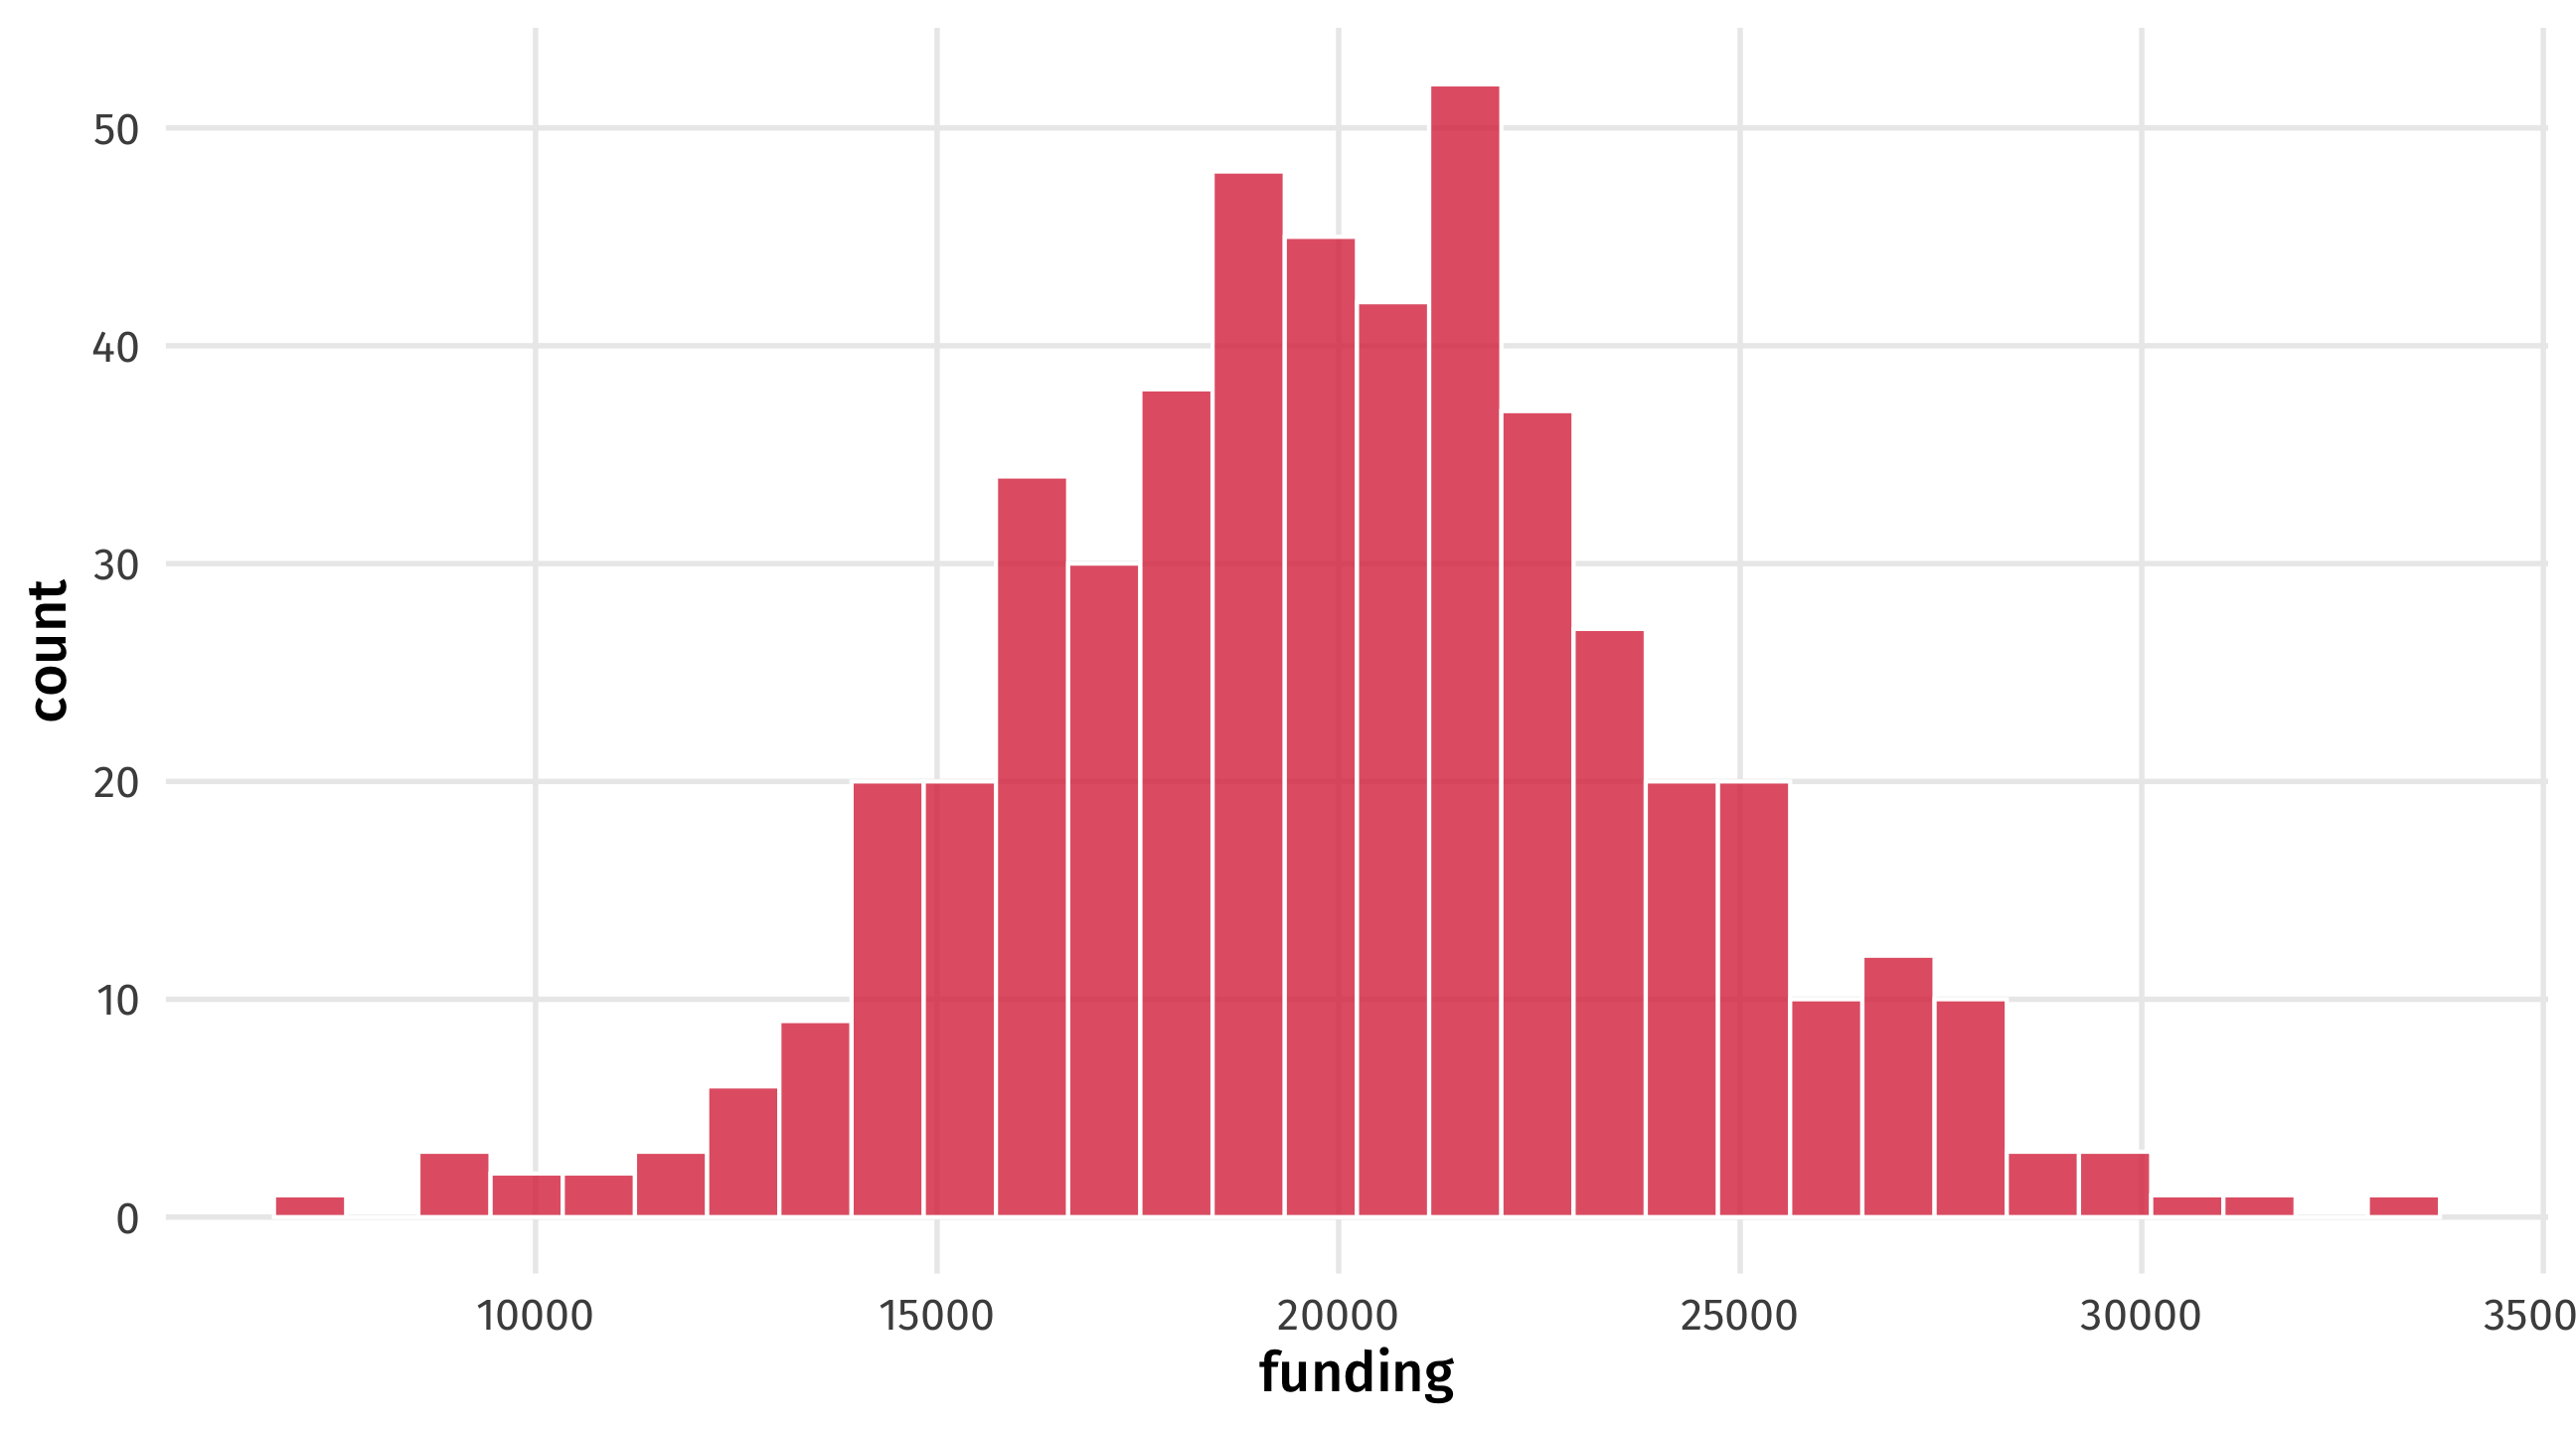
Eyeballing it
Is our fake data convincing? We can plot it to see:
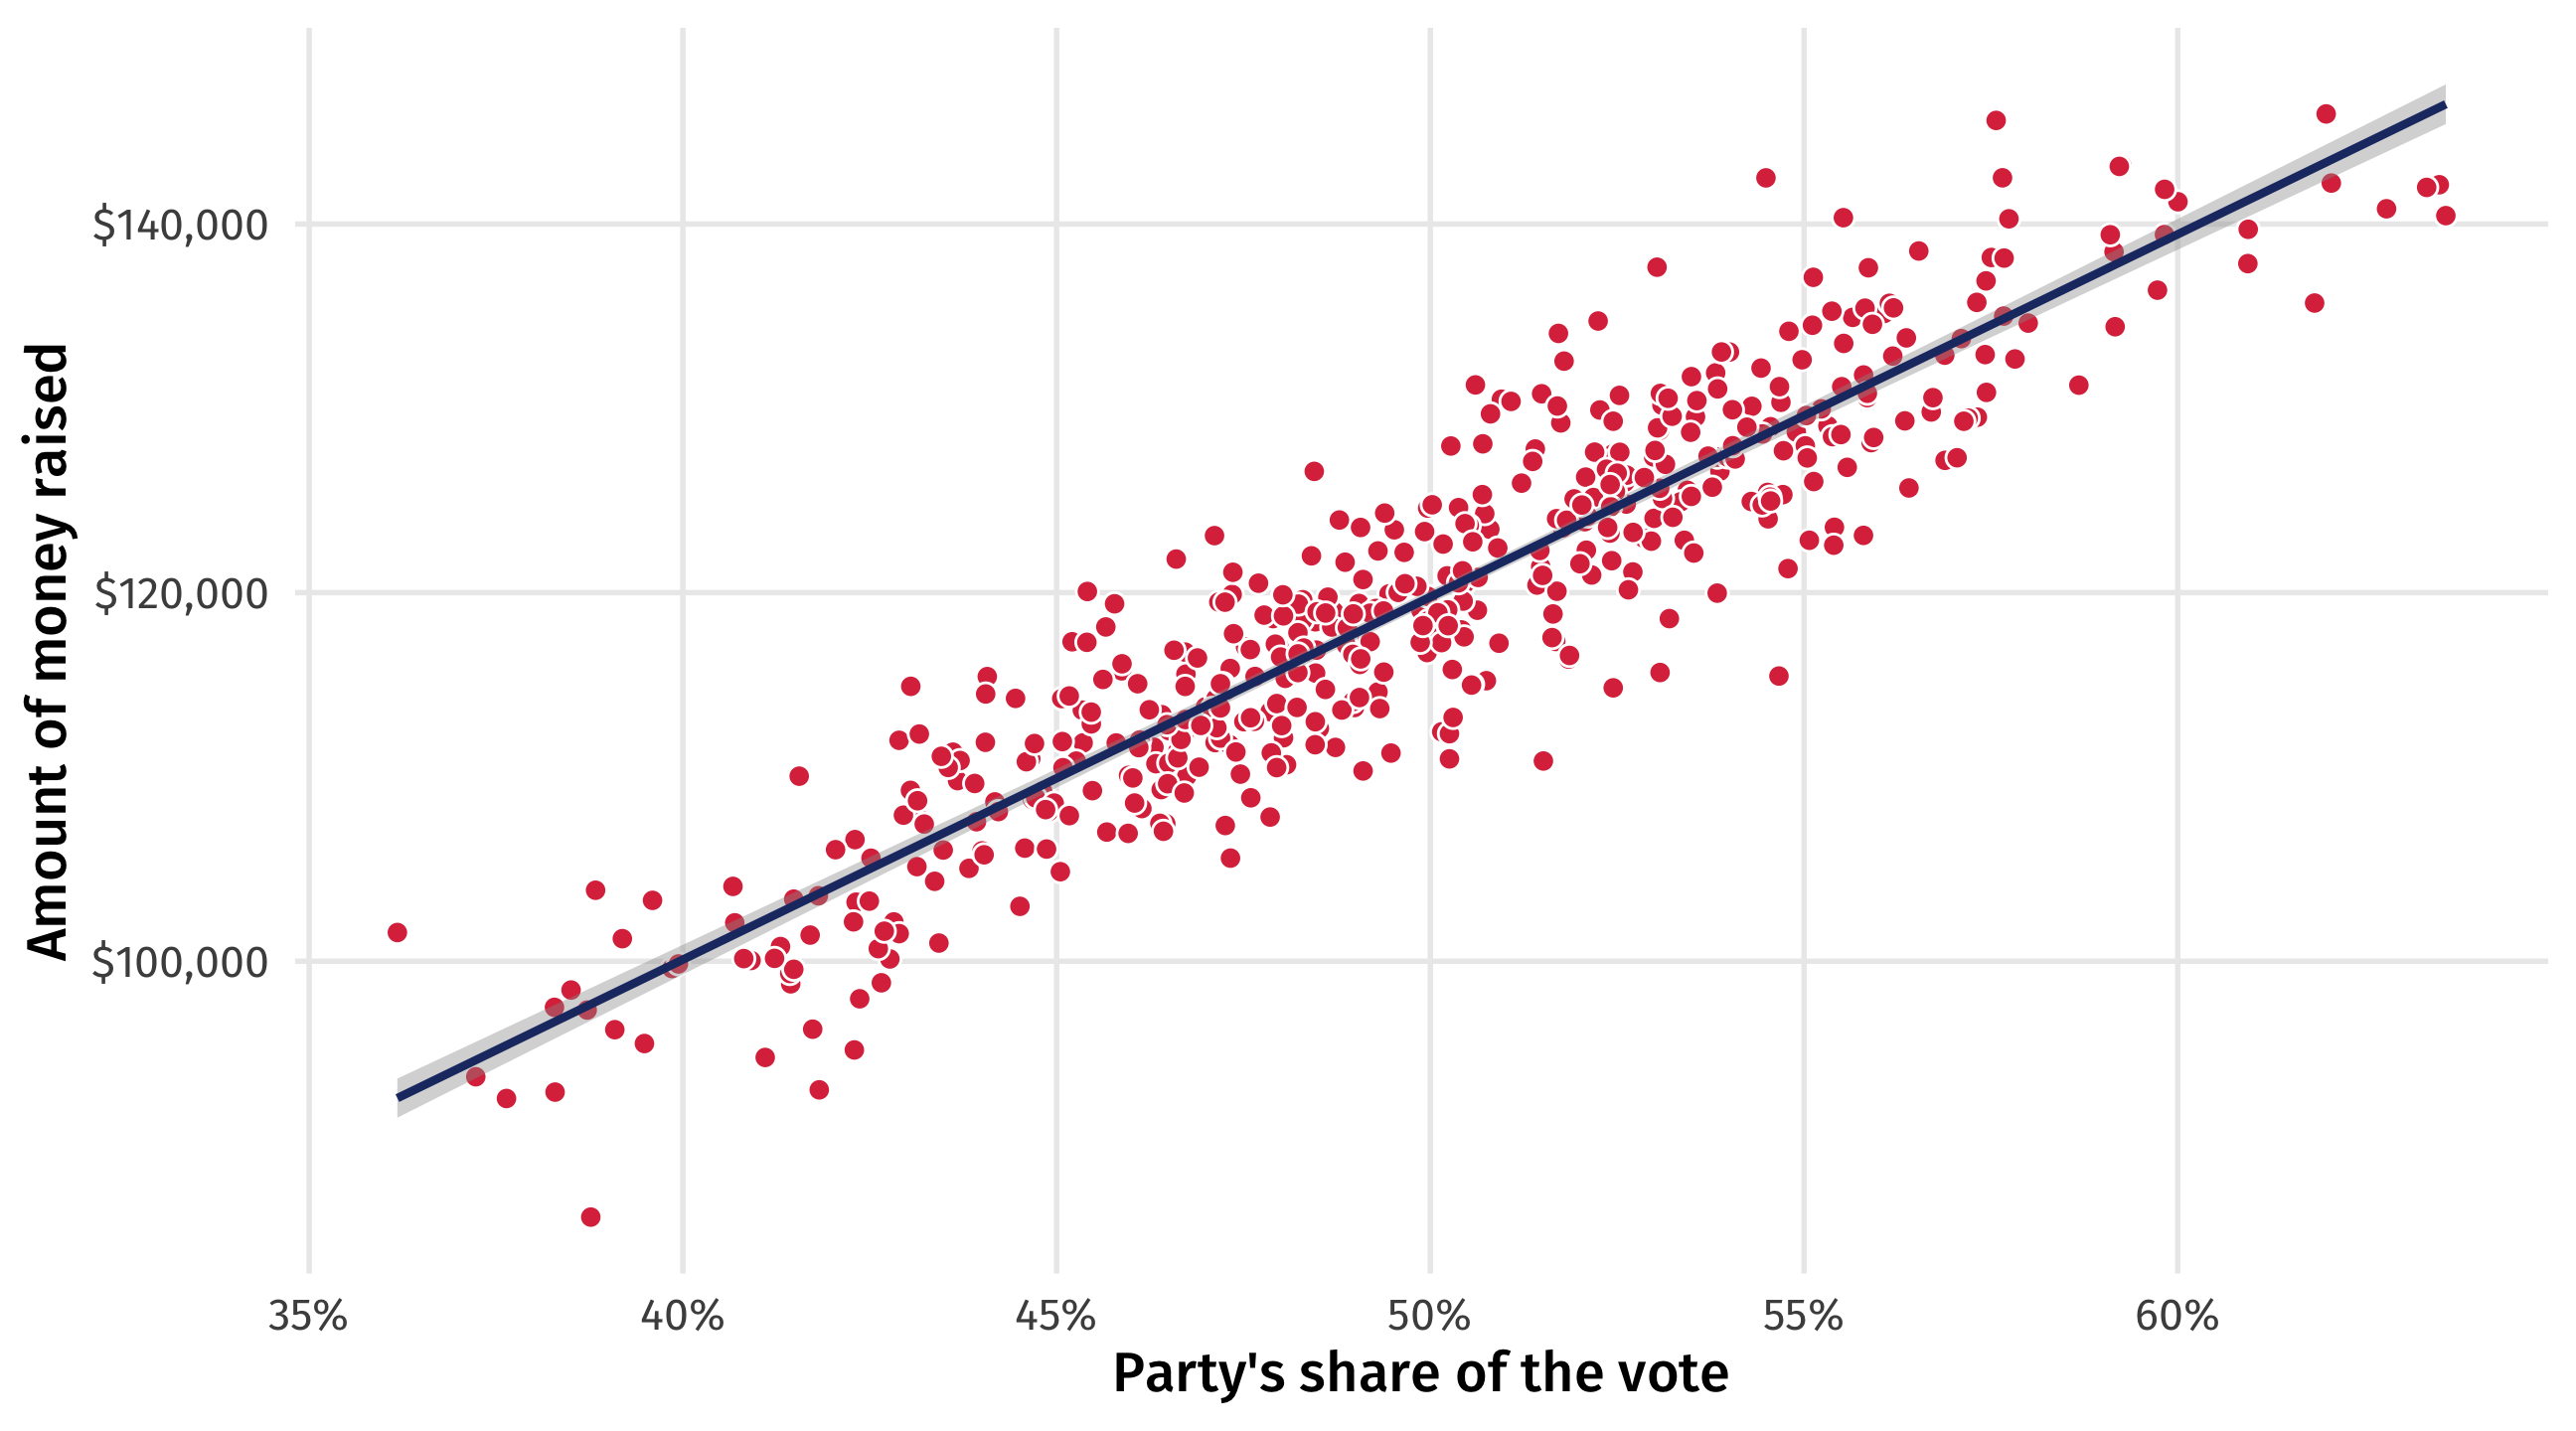
Hope?
- There are at least some scenarios where X causes Y, and
- This effect will be reflected in the data
- And we can estimate the effect with a model

🕵️ Your turn: Michael Lacour 🕵️
- Lacour published a big study in Science
- Study showed talking to LGBT canvasser \(\rightarrow\) huge improvements in attitudes towards LGBT policy (gay marriage)
- Data was completely fabricated, using some of the same functions I showed you